MATLAB: An Introduction with Applications
6th Edition
ISBN: 9781119256830
Author: Amos Gilat
Publisher: John Wiley & Sons Inc
expand_more
expand_more
format_list_bulleted
Question

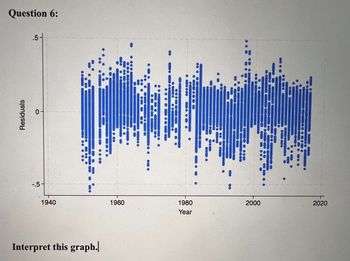
Transcribed Image Text:Question 6:
Residuals
.5
0-
-.5
1940
Interpret this graph.|
1960
●●●●
CO
OCCO
00000
DIO
1980
Year
2000
J!
2020
Expert Solution
This question has been solved!
Explore an expertly crafted, step-by-step solution for a thorough understanding of key concepts.
Step by stepSolved in 3 steps with 3 images

Knowledge Booster
Similar questions
- and decreasing. 10 3. segment 3 10-9 3 4 78 9 10 -5 一0 01- The function is v on the interval < x < (segment v on the interval (segment 2), and the interval (segment 3). segment 1arrow_forwardK 3:04 The data to the right represent the number of customers waiting for a table at 6:00 P.M. for 40 consecutive Saturdays at Bobak's Restaurant. Complete parts (a) through (h) below. Number of Customers 1-3 4-6 7-9 10-12 13-15 ||| = Frequency 12 O 15 11 14 11 13 14 12 15 13 66003a 8 2 | 46 | 2 18% LTE2 7 12 10 3 (a) Are these data discrete or continuous? Explain. A. The data are discrete because it was recorded for 40 consecutive Saturdays. B. The data are discrete because there are a finite or countable number of values. C. The data are continuous because there are a finite or countable number of values. OD. The data are continuous because it was recorded for 40 consecutive Saturdays. (b) Construct a frequency distribution of the data. 13 6 2490 9 12 10 6 7 7 40 8 12 10 14 9 10 11 8 10 10 9 12arrow_forwardwhich one?arrow_forward
- Plz answer correctly I will up vote for youarrow_forwardTIMELINE OR LINE GRAPH The Timeline Graphs necessary for this exercise are also in Public Files/Mod1 A timeline or line graph shows trends over time. This study examines whether there is any relationship between the season of the year and suicide rates. These two line graphs show rates per 100,000.This study was based on data from Hong Kong only for the years 1980 to 1994. Line Graph images 1.5 1.0 Figure 1. Average total and sex-specific monthly suicide rates, 1980-1994. (I Total, • Male, A Female) 0.5 0.0 Jan Feb Mar Apr May Jun Jul Aug Sep Oct Nov Dec Month Suicides per 100,000arrow_forwardE Collection of Poem X E Sawyer Collection x + 9 Inbox O Microsoft Word - U X oads/Algebra%201%20-%20Unit%204A%20Cycle%20%231.pdf E Reading list 1 / 3 - 100% ters o conteAt LO10 conter uppncu 1. This graph represents the volume of water (liters) in a cooler as a function of time, t (minutes). 12 * 10 8. 4 6 8 10 12 14 time (minutes) Decide whether the statement is true or false. If you say "false," please correct the statement. a. The vertical intercept shows how much water started in the cooler. b. The function reaches its maximum value at 4 minutes. C. The cooler started with no water in it. d. The function reaches its minimum value the same time it has a horizontal intercept. e. The cooler started and ended with the same volume of water. f. The vertical intercept shows how long it took for the cooler to get emptied. Here is a granh renresenting functions fand a Select all statements that are true about functions f and a 6:26 PM 75°F 2/25/2022 2. 7 38 no DPI 21 12 21 prt sc & 7. 8…arrow_forward
arrow_back_ios
arrow_forward_ios
Recommended textbooks for you
 MATLAB: An Introduction with ApplicationsStatisticsISBN:9781119256830Author:Amos GilatPublisher:John Wiley & Sons Inc
 Probability and Statistics for Engineering and th...StatisticsISBN:9781305251809Author:Jay L. DevorePublisher:Cengage Learning
 Statistics for The Behavioral Sciences (MindTap C...StatisticsISBN:9781305504912Author:Frederick J Gravetter, Larry B. WallnauPublisher:Cengage Learning
 Elementary Statistics: Picturing the World (7th E...StatisticsISBN:9780134683416Author:Ron Larson, Betsy FarberPublisher:PEARSON
 The Basic Practice of StatisticsStatisticsISBN:9781319042578Author:David S. Moore, William I. Notz, Michael A. FlignerPublisher:W. H. Freeman
 Introduction to the Practice of StatisticsStatisticsISBN:9781319013387Author:David S. Moore, George P. McCabe, Bruce A. CraigPublisher:W. H. Freeman

MATLAB: An Introduction with Applications
Statistics
ISBN:9781119256830
Author:Amos Gilat
Publisher:John Wiley & Sons Inc

Probability and Statistics for Engineering and th...
Statistics
ISBN:9781305251809
Author:Jay L. Devore
Publisher:Cengage Learning

Statistics for The Behavioral Sciences (MindTap C...
Statistics
ISBN:9781305504912
Author:Frederick J Gravetter, Larry B. Wallnau
Publisher:Cengage Learning

Elementary Statistics: Picturing the World (7th E...
Statistics
ISBN:9780134683416
Author:Ron Larson, Betsy Farber
Publisher:PEARSON

The Basic Practice of Statistics
Statistics
ISBN:9781319042578
Author:David S. Moore, William I. Notz, Michael A. Fligner
Publisher:W. H. Freeman

Introduction to the Practice of Statistics
Statistics
ISBN:9781319013387
Author:David S. Moore, George P. McCabe, Bruce A. Craig
Publisher:W. H. Freeman