MATLAB: An Introduction with Applications
6th Edition
ISBN: 9781119256830
Author: Amos Gilat
Publisher: John Wiley & Sons Inc
expand_more
expand_more
format_list_bulleted
Concept explainers
Question
Find the slope
Find the correlation
Find the RSME

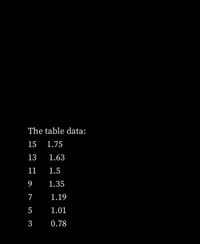
Transcribed Image Text:The table data:
15
1.75
13
1.63
11
1.5
9
1.35
7
1.19
1.01
0.78
5 3

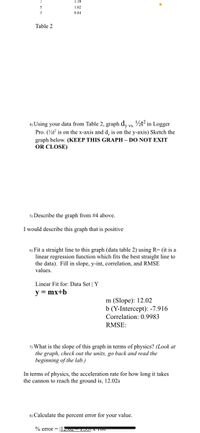
Transcribed Image Text:1.19
1.02
0.84
Table 2
4) Using your data from Table 2, graph d, vs. ½t² in Logger
Pro. (½t is on the x-axis and d, is on the y-axis) Sketch the
graph below. (KEEP THIS GRAPH – DO NOT EXIT
OR CLOSE)
5) Describe the graph from #4 above.
I would describe this graph that is positive
6) Fit a straight line to this graph (data table 2) using R= (it is a
linear regression function which fits the best straight line to
the data). Fill in slope, y-int, correlation, and RMSE
values.
Linear Fit for: Data Set | Y
y = mx+b
m (Slope): 12.02
b (Y-Intercept): -7.916
Correlation: 0.9983
RMSE:
7) What is the slope of this graph in terms of physics? (Look at
the graph, check out the units, go back and read the
beginning of the lab.)
In terms of physics, the acceleration rate for how long it takes
the cannon to reach the ground is, 12.02s
8) Calculate the percent error for your value.
% error = I2.v T EA T00
anm
Expert Solution
This question has been solved!
Explore an expertly crafted, step-by-step solution for a thorough understanding of key concepts.
Step by stepSolved in 5 steps

Knowledge Booster
Learn more about
Need a deep-dive on the concept behind this application? Look no further. Learn more about this topic, statistics and related others by exploring similar questions and additional content below.Similar questions
- Which scatter plot shown has a correlation coefficient, r, closest to -1? Graph A Graph B Graph C Both graphs A and B.arrow_forwardForest Fires and Acres Burned Numbers (in thousands) of forest fires over the year and the number (in hundred thousands) of acres burned for 7 recent years are shown. Number of fires x 69 58 47 84 62 57 72 Number of acres burned y 72 61 50 87 65 60 75 The correlation coefficient for the data is r=1 and α=0.05. Should regression analysis be done? The regression analysis should not be done. The regression analysis should be done. Find the equation of the regression line. y'′=a+bx a= b= Find y'′ when x=60 y'=.arrow_forwardForest Fires and Acres Burned Numbers (in thousands) of forest fires over the year and the number (in hundred thousands) of acres burned for 7 recent years are shown. Number of fires x 72 69 58 47 84 62 57 Number of acres burned y 74 71 60 49 86 64 59 Send data to Excel The correlation coefficient for the data is r= 1 and a=0.05. Should regression analysis be done? The regression analysis should not be done. The regression analysis should be done. Find the equation of the regression line. y'=a+bx a b. Find y' when x=55. y' = %3D toarrow_forward
- e-iarrow_forwardEQuestion Help Find the equation of the regression line for the given data. Then construct a scatter plot of the data and draw the regression line. (The pair of variables have a significant correlation) Then use the regression equation to predict the value of y for each of the given x-values, if meaningful. The number of hours 6 students spent for a test and their scores on that test are shown below. Hours spent studying, x IA Test score,y 3 (a) x=2 hours (c) x= 12 hours (b) x = 25 hours (d) x= 4.5 hours 38 44 50 47 61 68 Find the regression equation. y = 6.269 x+ (32.48) (Round the slope to three decimal places as needed. Round the y-intercept to two decimal places as needed.) Choose the correct graph below. OD. OB. OC. O A. 80- 80- 80 80-4 0-+ Hours studying Hours studying Hours studying Hours studying 10 18 PM (E) More 10/3/2020 Click to select your answer(s)arrow_forwardThe scatter plot shows the relationship between the number of minutes studying for a test (x) and the Score earned (y). Make a scatterplot for the data. Time Studying (x) 40 50 60 70 80 90 100 110 Score (y) 2 3 6 7 9. +H+ 10 6. -7- 4 3 1- 10, 10 20 30 40 50 60 70 80 90 100 110 12 7:04 PM Desktop 12/8/2026arrow_forward
- Part d The slope is?arrow_forwardA correlation coefficient measures the strength of the linear relationship between two variables Select one: True False Check The closer the correlation coefficient is to -1 the more spread out the data set is. Select one: True False Check tvarrow_forwardPls someone help I really need these answers fast Using the graphing calculator, type in the table and complete a linear regression. The value of the correlation coefficient is found next to the letter (__) in the table. The value of the correlation coefficient is (__) [round to the hundredths place]. When the correlation coefficient is interpreted, it means that the correlation is (__) and (__). This means the points will be (__) [close or further away] to the line.arrow_forward
arrow_back_ios
arrow_forward_ios
Recommended textbooks for you
 MATLAB: An Introduction with ApplicationsStatisticsISBN:9781119256830Author:Amos GilatPublisher:John Wiley & Sons Inc
 Probability and Statistics for Engineering and th...StatisticsISBN:9781305251809Author:Jay L. DevorePublisher:Cengage Learning
 Statistics for The Behavioral Sciences (MindTap C...StatisticsISBN:9781305504912Author:Frederick J Gravetter, Larry B. WallnauPublisher:Cengage Learning
 Elementary Statistics: Picturing the World (7th E...StatisticsISBN:9780134683416Author:Ron Larson, Betsy FarberPublisher:PEARSON
 The Basic Practice of StatisticsStatisticsISBN:9781319042578Author:David S. Moore, William I. Notz, Michael A. FlignerPublisher:W. H. Freeman
 Introduction to the Practice of StatisticsStatisticsISBN:9781319013387Author:David S. Moore, George P. McCabe, Bruce A. CraigPublisher:W. H. Freeman

MATLAB: An Introduction with Applications
Statistics
ISBN:9781119256830
Author:Amos Gilat
Publisher:John Wiley & Sons Inc

Probability and Statistics for Engineering and th...
Statistics
ISBN:9781305251809
Author:Jay L. Devore
Publisher:Cengage Learning

Statistics for The Behavioral Sciences (MindTap C...
Statistics
ISBN:9781305504912
Author:Frederick J Gravetter, Larry B. Wallnau
Publisher:Cengage Learning

Elementary Statistics: Picturing the World (7th E...
Statistics
ISBN:9780134683416
Author:Ron Larson, Betsy Farber
Publisher:PEARSON

The Basic Practice of Statistics
Statistics
ISBN:9781319042578
Author:David S. Moore, William I. Notz, Michael A. Fligner
Publisher:W. H. Freeman

Introduction to the Practice of Statistics
Statistics
ISBN:9781319013387
Author:David S. Moore, George P. McCabe, Bruce A. Craig
Publisher:W. H. Freeman