MATLAB: An Introduction with Applications
6th Edition
ISBN: 9781119256830
Author: Amos Gilat
Publisher: John Wiley & Sons Inc
expand_more
expand_more
format_list_bulleted
Topic Video
Question

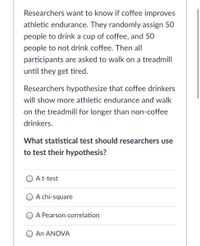
Transcribed Image Text:Researchers want to know if coffee improves
athletic endurance. They randomly assign 50
people to drink a cup of coffee, and 50
people to not drink coffee. Then all
participants are asked to walk on a treadmill
until they get tired.
Researchers hypothesize that coffee drinkers
will show more athletic endurance and walk
on the treadmill for longer than non-coffee
drinkers.
What statistical test should researchers use
to test their hypothesis?
O At-test
A chi-square
O A Pearson correlation
An ANOVA

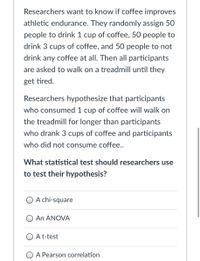
Transcribed Image Text:Researchers want to know if coffee improves
athletic endurance. They randomly assign 50
people to drink 1 cup of coffee, 50 people to
drink 3 cups of coffee, and 50 people to not
drink any coffee at all. Then all participants
are asked to walk on a treadmill until they
get tired.
Researchers hypothesize that participants
who consumed 1 cup of coffee will walk on
the treadmill for longer than participants
who drank 3 cups of coffee and participants
who did not consume coffee..
What statistical test should researchers use
to test their hypothesis?
A chi-square
An ANOVA
A t-test
O A Pearson correlation
Expert Solution
This question has been solved!
Explore an expertly crafted, step-by-step solution for a thorough understanding of key concepts.
This is a popular solution
Trending nowThis is a popular solution!
Step by stepSolved in 3 steps

Knowledge Booster
Learn more about
Need a deep-dive on the concept behind this application? Look no further. Learn more about this topic, statistics and related others by exploring similar questions and additional content below.Similar questions
- Empathy among police officers influences how they interact with citizens and the likelihood that they receive complaints. Gender differences in levels of empathy in the general population are not large but male and female officers have been shown to have different interaction styles with the public; this may be due to the different empathy levels. After sampling officers and measuring their levels of empathy you find the following data. Males Females n = 6 n = 9 M = 31 M = 45 SS = 490 SS = 680 If you were going to make gender comparisons like this, which option would be the correct choice? Write A or B in the box. [a] Option A. Independent-measures t-test Option B. Repeated-measures t-testarrow_forwardWhy should researchers taught to be cautious when interpreting a correlation?arrow_forwardWhat’s the effect? A researcher studying violent behav-ior in elementary school children asks the children’s par-ents how much time each child spends playing computer games and has their teachers rate each child on the levelof aggressiveness they display while playing with otherchildren. Suppose that the researcher finds a moderately strong positive correlation. Describe three different pos-sible cause-and-effect explanations for this relationship.arrow_forward
- What is the null hypothesis of a test for correlation? There is correlation in the population. There is positive correlation in the population. There is no correlation in the population. There is negative correlation in the population.arrow_forwardab! ourses The accompanying technology output was obtained by using the paired data consisting of foot lengths (cm) and heights (cm) of a sample of 40 people. Along with the paired sample data, the technology was also given a foot length of 13.6 cm to be used for predicting height. The technology found that there is a linear correlation between height and foot length. If someone has a foot length of 13.6 cm, what is the single value that is the best predicted height for that person? "se Hom E Click the icon to view the technology output. abus The single value that is the best predicted height is cm. endar (Round to the nearest whole number as needed.) entation ktbook a-F on unouncem ssignment: cudy Plan radebook Hydrogen Report.pdf Enter your answer in the answer box. Screen Shot 20-11...9.53 P 5,981 10 tv MacBook Pro (5arrow_forward10.In a study we reject Ho Which of the following statements are incorrect and why? (a) "Now we know that H, is false." (b) "We have proof that our sample mean represents a particular p." (c) "We have proof that the independent variable causes scores to change as predicted." (d) "It is not pos- sible that the difference between X and u is due to sampling error." (e) "We have evidence that the predicted relationship doesarrow_forward
- In running a Pearson correlation, you notice that there are a few outliers. Please describe the next course of action, if any, for the dataset and explain your reasoning.arrow_forwardAn exercise scientist wants to know if there is a relationship between explosive leg power and standing jump height. To determine if a relationship exists, a group of 30 participants' (N = 30) Leg power was measured by recording each participants' single squat weight max (in pounds). Next, each participant was asked to perform a standing jump and their Jump height was recorded (in meters). Using the variables “Leg power” and “Jump height”, conduct a Pearson's Correlation, at α = 0.05, to determine if leg power and jump height are correlated. Identify the correct null hypothesis A. H0: There is no relationship between leg power and jump height B. H0: There is a relationship between leg power and jump height C. HA: There is a relationship between leg power and jump height D. HA: There is no relationship between leg power and jump heightarrow_forwardAn exercise scientist wants to know if there is a relationship between explosive leg power and standing jump height. To determine if a relationship exists, a group of 30 participants' (N = 30) Leg power was measured by recording each participants' single squat weight max (in pounds). Next, each participant was asked to perform a standing jump and their Jump height was recorded (in meters). Using the variables “Leg power” and “Jump height”, conduct a Pearson's Correlation, at α = 0.05, to determine if leg power and jump height are correlated. What does this type of correlation indicate about how leg strength and jump height change together? A. Both leg strength and jump height increase and decrease together B. There is no relationship between leg strength and jump height C. As leg strength increases, jump height decreases D. As jump height increases, leg strength decreasesarrow_forward
- Choose the appropriate statistical test. When computing, be sure to round each answer as indicated. A dentist wonders if depression affects ratings of tooth pain. In the general population, using a scale of 1-10 with higher values indicating more pain, the average pain rating for patients with toothaches is 6.8. A sample of 30 patients that show high levels of depression have an average pain rating of 7.1 (variance 0.8). What should the dentist determine? 1. Calculate the estimated standard error. (round to 3 decimals). [st.error] 2. What is thet-obtained? (round to 3 decimals). 3. What is the t-cv? (exact value) 4. What is your conclusion? Only type "Reject" or Retain"arrow_forwardAlpha equals 0.01 level of significance for the given sample data.arrow_forward. Dr. Hafen is doing research on the effects of study time (how many minutes students study) on test performance (their score on an exam). He hypothesizes that the amount of study time will impact an individual’s performance on the exam. Then Dr. Hafen collects data on 100 students. He collects data on their ‘study time’ and their ‘exam performance’, then runs a Pearson correlation. In your own words, please describe what Dr. Hafen’s null hypothesis would be and what Dr. Hafen’s alternative hypothesis would be. If Dr. Hafen makes a Type I error, what would that mean in the context of this study? If he makes a Type II error, what would that mean in the context of this study?arrow_forward
arrow_back_ios
SEE MORE QUESTIONS
arrow_forward_ios
Recommended textbooks for you
 MATLAB: An Introduction with ApplicationsStatisticsISBN:9781119256830Author:Amos GilatPublisher:John Wiley & Sons Inc
 Probability and Statistics for Engineering and th...StatisticsISBN:9781305251809Author:Jay L. DevorePublisher:Cengage Learning
 Statistics for The Behavioral Sciences (MindTap C...StatisticsISBN:9781305504912Author:Frederick J Gravetter, Larry B. WallnauPublisher:Cengage Learning
 Elementary Statistics: Picturing the World (7th E...StatisticsISBN:9780134683416Author:Ron Larson, Betsy FarberPublisher:PEARSON
 The Basic Practice of StatisticsStatisticsISBN:9781319042578Author:David S. Moore, William I. Notz, Michael A. FlignerPublisher:W. H. Freeman
 Introduction to the Practice of StatisticsStatisticsISBN:9781319013387Author:David S. Moore, George P. McCabe, Bruce A. CraigPublisher:W. H. Freeman

MATLAB: An Introduction with Applications
Statistics
ISBN:9781119256830
Author:Amos Gilat
Publisher:John Wiley & Sons Inc

Probability and Statistics for Engineering and th...
Statistics
ISBN:9781305251809
Author:Jay L. Devore
Publisher:Cengage Learning

Statistics for The Behavioral Sciences (MindTap C...
Statistics
ISBN:9781305504912
Author:Frederick J Gravetter, Larry B. Wallnau
Publisher:Cengage Learning

Elementary Statistics: Picturing the World (7th E...
Statistics
ISBN:9780134683416
Author:Ron Larson, Betsy Farber
Publisher:PEARSON

The Basic Practice of Statistics
Statistics
ISBN:9781319042578
Author:David S. Moore, William I. Notz, Michael A. Fligner
Publisher:W. H. Freeman

Introduction to the Practice of Statistics
Statistics
ISBN:9781319013387
Author:David S. Moore, George P. McCabe, Bruce A. Craig
Publisher:W. H. Freeman