
MATLAB: An Introduction with Applications
6th Edition
ISBN: 9781119256830
Author: Amos Gilat
Publisher: John Wiley & Sons Inc
expand_more
expand_more
format_list_bulleted
Related questions
Question
thumb_up100%
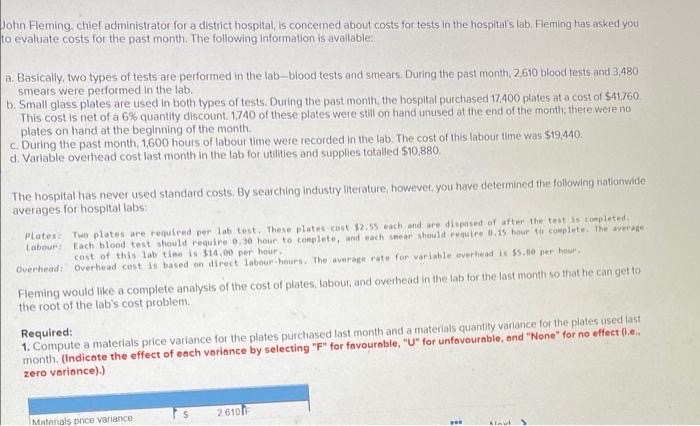

Transcribed Image Text:John Fleming, chief administrator for a district hospital, is concemed about costs for tests In the hospital's lab. Fleming has asked you
to evaluate costs for the past month. The following Information is avallable:
a. Basically, two types of tests are performed in the lab-blood tests and smears. During the past month, 2,610 blood tests and 3,480
smears were performed in the lab.
b. Small glass plates are used in both types of tests. During the past month, the hospital purchased 17.400 plates at a cost of $41,760
This cost is net of a 6% quantity discount. 1,740 of these plates were still on hand unused at the end of the month; there were no
plates on hand at the beginning of the month.
c. During the past month, 1,600 hours of labour time were recorded in the lab. The cost of this labour time was $19,440.
d. Varlable overhead cost last month in the lab for utilities and supplies totalled $10,880.
The hospital has never used standard costs. By searching industry literature, hoever, you have determined the following nationwide
averages for hospital labs:
Plates
Two plates are required per lab test, These plates cost $2.55 each and are disposed of after the test is completed.
Labour: Each blood test should require 0.30 hour to complete, and each snear should require 0.15 hour to complete. The average
cost of this lab tine is $14.00 per hour.
Overhead: overhead cost is based on direct labour-hours. The average rate for variable overhead is $5.80 per hour.
Fleming would like a complete analysis of the cost of plates, labour, and overhead in the lab for the last month so that he can get to
the root of the lab's cost problem.
Required:
1. Compute a materials price variance for the plates purchased last month and a materials quantity variance for the plates used last
month. (Indicate the effect of each variance by selecting "F" for favourable, "U" for unfavourable, and "None" for no effect (i.e.,
zero verionce).)
2610
Materials price variance
Aleut

Transcribed Image Text:Materials price variance
2,610F
12,180 U
Matenals quantity variance
nces
2. For labour cost in the lab:
a. Compute a labour rate variance and a labour efficiency variance. (Do not round intermediete calculations. Round "Efficiency
varionce" answer to 2 decimal places. Indicate the effect of ench variance by selecting "F" for favourable, "U" for unfovourable,
and "None" for no effect (i.e., zero variance).)
Labour rate variance
Labour efficiency variance
Expert Solution
This question has been solved!
Explore an expertly crafted, step-by-step solution for a thorough understanding of key concepts.

This is a popular solution

Trending nowThis is a popular solution!

Step by stepSolved in 2 steps

Knowledge Booster

Similar questions
- 3. Table 1 shows the median rent per m² in Berlin, for each of the 12 districts, and for all market segments, for the years 2020 (variable ✗) and 2021 (variable Y). For these data, the following is known: 12 IM i=1 (b) 12 12 12 12 for π; = 124.31, Σy = 127.93, Στ = 1326.6657, Σy = 1408.3461, Σriyi = 1365.7266 i=1 Calculate and y. 2=1 i=1 i=1 Calculate the sample variance for X and Y. Hint: For the sample variance the following formula holds: (c) (d) n Σ? - 2 Σ + n n 1 S = n-1 i=1 i=1 Calculate the sample standard deviation for X and Y. Calculate the covariance and the correlation coefficient. Recall: The formula for the correlation coefficient is suitable SXY TXY = SXSYarrow_forwardAre nursing salaries in City A lower than those in City B? As reported by a newspaper, salary data show staff nurses in City A earn less than staff nurses in City B. Suppose that in a follow-up study of 40 staff nurses in City A and 50 staff nurses in City B you obtain the following results. Assume population variances are unknown and unequal. City A City B n1 = 40 n2 50 X1 = $56,600 x2 = $59,500 S1 = $6,000 S2 = $7,000 (a) Formulate hypotheses so that, if the null hypothesis is rejected, we can conclude that salaries for staff nurses in City A are significantly lower than for those in City B. Use a = 0.05. Ho: H1 - 42 # 0 Ha: H1 - H2 = 0 Hoi Hq- Hz = 0 Hai M1- Hz 0 Ha: H1 - H2 = 0 Ho: H1 - 42 s0 Ha: H1 - H2 > 0 Ho: H1 - H2 < 0 Ha: H1 - 42 + 0 (b) What is the value of the test statistic? (Round your answer to three decimal places.) (c) What is the p-value? The degrees of freedom for this test are 87. (Round your answer to four decimal places.) p-value (d) What is your conclusion? Do…arrow_forwardThe concentration level of Zinc in milligrams in two types of soil was found to be as follows Soil A: 2.1 4.0 6.3 5.4 4.8 3.7 6.1 3.3 Soil B: 0.6 3.1 2.5 4.0 6.2 1.6 2.2 1.9 5.4 To check the claim that the medians of concentration level in the two soils were unequal, we conducted an appropriate test at and we found that the test statistics is equal to a. 57 b. 65 c. 47 d. None Decision a. we reject the claim b. we fail to reject the claim c. we can’t decide d. Nonearrow_forward
- solve for j and karrow_forwardFigure I shows the age and annual DDS expenditures for 376 Hispanic and 401 white non hispanic DDS recipients. Based on the scatter plot, determine whether each of the following statements is TRUE or FALSE no explanaition is needed: Older DDS recipients generally had higher annual DDS expenditures The histogram of annual DDS expenditures would be unimodal. The median annual DDS expenditures of these DDS recipients would be higher than their mean annual DDS expenditures.arrow_forward1. 2. 4. 1. 2. The distribution of a sample of 100 test scores is mound-shaped and symmetrical, with a mean of 50 and a variance of 144. 3. a) b) c) 4. d) 3. a) a) A sample of 200 people were given a test. The distribution of the test scores was mound- shaped and symmetrical with a mean of 100. One person, whose test score was 125, was found to be at the 84th percentile. b) d) Answers: b) Approximately how many scores are equal to or greater than 74? What score corresponds to the 75th percentile? If the lowest and highest scores in this sample are 14 and 89, respectively, what is the range of the scores in standard deviation units? b) Assume that the 100 test scores still have a mean of 50 and a variance of 144, but now have a strongly negatively skewed distribution. At least how many of the scores fall between 32 and 68 in this distribution? What is the Z-score of a person whose test score is 70? Approximately how many people obtained scores greater than 135? Approximately how many…arrow_forward
- Sanchez & Hall, a research firm for the real estate industry, studied the relation between x = annual income (in thousands of dollars) and y= sale price of house purchased (in thousands of dollars). A random sample of data was collected from mortgage applications for home sales in the region of the study, and is given in the table. Annual Income House Price 215.7 211 144.7 278.5 319.5 236.8 144.8 204 286.8 97 120 73 107 135 81 72 ס|א|א 70 108arrow_forwardSuppose u, and u, are true mean stopping distances at 50 mph for cars of a certain type equipped with two different types of braking systems. The data follows: m = 5, x = 115.1, s, = 5.05, n = 5, y = 129.2, and s, = 5.36. Calculate a 95% CI for the difference between true average stopping distances for cars equipped with system 1 and cars equipped with system 2. (Round your answers to two decimal places.) n USE SALT Does the interval suggest that precise information about the value of this difference is available? O Because the interval is so narrow, it appears that precise information is available. o Because the interval is so wide, it appears that precise information is not available. o Because the interval is so narrow, it appears that precise information is not available. Because the interval is so wide, it appears that precise information is available. You may need to use the appropriate table in the Appendix of Tables to answer this question.arrow_forwardA Hollywood studio believes that a movie that is considered a drama will draw a larger crowd on average than a movie that is considered a comedy. To test this theory, the studio randomly selects several movies that are classified as dramas and several movies that are classified as comedies and determines the box office revenue for each movie. The results of the survey are as follows. Assume that the population variances are approximately equal. Box Office Revenues (Millions of Dollars) n Drama 10 160 30 Comedy 15 140 10 Copy Data Calculate a 99 % confidence interval for the difference in mean revenue at the box office for drama and comedy movies. Let dramas be Population 1 and comedies be Population 2. Write your answer using interval notation and round the interval endpoints to two decimal places.arrow_forward
- 2. [-/1 Points] y Plot the data from the following table. y 24 22 20 18 16 14 12 10 0 24 22 20 18 16 14 12 10 Submit Answer DETAILS 0 X 1 у 10 2 2 + 4 4 3 5 7 11 13 15 6 6 CRAUDCOLALG6 3.3.SB.005. + 8 8 10 X X 10 12 + 12 14 14 16 16 18 y 24 22- 20 18 16 14- 12- 10 -10 + 2 4 + + y + 24 22 20 18 16- 14 12- ·co 6 0 + 8 10 X 5 X 10 12 14 15 16 MY NOTES ASK YOUR TEACHERarrow_forwardThe Variance of Population for the following data:X = 155, 175, 125, 155, 175, %3D 195, 185, 525, 255, 425, 355, 455 is : * O 19350 O 15403 O 18600 O 17400arrow_forwardtled1.tst 1 / 1 dent/Downloads/Math%201332%20Activity%20%236.pdf X 1 Find the mean, mode, median and midrange. 2) 2 Score Frequency 3 4 5 X 6 Math 1332 Activity #6.pdf: 6231- 7 8 9 10 119% + B HLSATOOGEE f 1 5 4 7 6 10 12 11arrow_forward
arrow_back_ios
SEE MORE QUESTIONS
arrow_forward_ios
Recommended textbooks for you
- MATLAB: An Introduction with ApplicationsStatisticsISBN:9781119256830Author:Amos GilatPublisher:John Wiley & Sons Inc
 Probability and Statistics for Engineering and th...StatisticsISBN:9781305251809Author:Jay L. DevorePublisher:Cengage Learning
 Statistics for The Behavioral Sciences (MindTap C...StatisticsISBN:9781305504912Author:Frederick J Gravetter, Larry B. WallnauPublisher:Cengage Learning
  Elementary Statistics: Picturing the World (7th E...StatisticsISBN:9780134683416Author:Ron Larson, Betsy FarberPublisher:PEARSON
 The Basic Practice of StatisticsStatisticsISBN:9781319042578Author:David S. Moore, William I. Notz, Michael A. FlignerPublisher:W. H. Freeman
 Introduction to the Practice of StatisticsStatisticsISBN:9781319013387Author:David S. Moore, George P. McCabe, Bruce A. CraigPublisher:W. H. Freeman
MATLAB: An Introduction with Applications
Statistics
ISBN:9781119256830
Author:Amos Gilat
Publisher:John Wiley & Sons Inc
Probability and Statistics for Engineering and th...
Statistics
ISBN:9781305251809
Author:Jay L. Devore
Publisher:Cengage Learning
Statistics for The Behavioral Sciences (MindTap C...
Statistics
ISBN:9781305504912
Author:Frederick J Gravetter, Larry B. Wallnau
Publisher:Cengage Learning
Elementary Statistics: Picturing the World (7th E...
Statistics
ISBN:9780134683416
Author:Ron Larson, Betsy Farber
Publisher:PEARSON
The Basic Practice of Statistics
Statistics
ISBN:9781319042578
Author:David S. Moore, William I. Notz, Michael A. Fligner
Publisher:W. H. Freeman
Introduction to the Practice of Statistics
Statistics
ISBN:9781319013387
Author:David S. Moore, George P. McCabe, Bruce A. Craig
Publisher:W. H. Freeman