
MATLAB: An Introduction with Applications
6th Edition
ISBN: 9781119256830
Author: Amos Gilat
Publisher: John Wiley & Sons Inc
expand_more
expand_more
format_list_bulleted
Related questions
Question
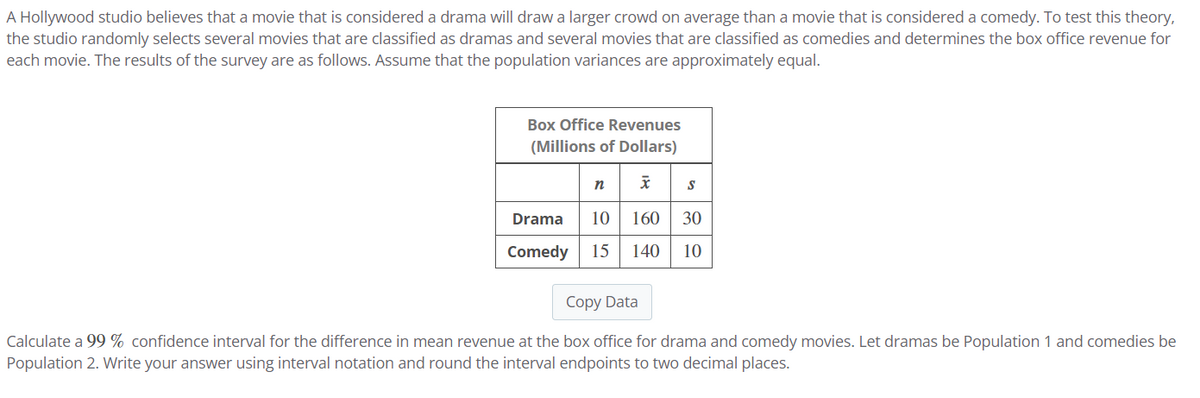

Transcribed Image Text:A Hollywood studio believes that a movie that is considered a drama will draw a larger crowd on average than a movie that is considered a comedy. To test this theory,
the studio randomly selects several movies that are classified as dramas and several movies that are classified as comedies and determines the box office revenue for
each movie. The results of the survey are as follows. Assume that the population variances are approximately equal.
Box Office Revenues
(Millions of Dollars)
n
Drama 10 160 30
Comedy 15 140 10
Copy Data
Calculate a 99 % confidence interval for the difference in mean revenue at the box office for drama and comedy movies. Let dramas be Population 1 and comedies be
Population 2. Write your answer using interval notation and round the interval endpoints to two decimal places.
Expert Solution
This question has been solved!
Explore an expertly crafted, step-by-step solution for a thorough understanding of key concepts.

This is a popular solution

Trending nowThis is a popular solution!

Step by stepSolved in 3 steps

Knowledge Booster

Similar questions
- Are cigarettes bad for people? Cigarette smoking involves tar, carbon monoxide, and nicotine (measured in milligrams). The first two are definitely not good for a person's health, and the last ingredient can cause addiction. Use the data in the table above to make a stem-and-leaf display for milligrams of tar per cigarette smoked. (Enter NONE in any unused answer blanks.) Are there any outliers? A. Yes, 1.0 may be an outlier. B. No, there are no outliers. C. Yes, 29.8 may be an outlier.arrow_forwardConsider the following data. −1,2,2,−4,−4,−1−1,2,2,−4,−4,−1 Determine the mean of the given data.arrow_forwardPlease do not give solution in image format thankuarrow_forward
- Place the following data in a stem and leaf plot. 137 129 116 114 130 121 124 135 139 132 117 You can draw the stem and leaf plot on paper and then check your answer against the solution. You don't have to put anything in the answer box. A 13arrow_forwardThe two-way table given shows the results from a survey of pet owners. Owns a Dog Does Not Own a Dog Total Owns a Cat 54 21 75 Does Not Own a Cat 81 39 120 Total 135 60 195 Does the data show an association between owning a dog and owning a catarrow_forwardSample grade point averages for ten male students and ten female students are listed. Find the coefficient of variation for each of the two data sets. Then compare the results. Males 2.3 3.8 3.9 3.7 2.6 2.4 3.6 3.2 3.9 1.8 Females 2.7 3.6 2.2 3.9 3.7 4.2 1.9 3.9 3.6 2.1 ... The coefficient of variation for males is %. (Round to one decimal place as needed.) The coefficient of variation for females is %. (Round to one decimal place as needed.) Compare the variability of grade point averages of males and females. Choose the correct answer below. O A. The grade point averages of females and males have the same variation. O B. The grade point averages of males are more variable than females. O C. The grade point averages of females and males do not vary. O D. The grade point averages of females are more variable than males.arrow_forward
- What is the coefficient of the dummy variable? What is the meaning of the coefficient of the dummy variable?arrow_forwardA record of a chess match records the chess piece used, the location of the piece and the length of time used to make the move. Classify each variable as qualitative or quantitative. A sample data table is listed below Piece Location pawn B3 rook C7 queen A6 0000 Move time (in seconds) 65 84 53 Piece - qualitative; location - quantitative; move time - quantitative Piece - quantitative; location - quantitative; move time - qualitative Piece - qualitative; location - qualitative; move time - quantitative Piece - qualitative; location - quantitative; move time - qualitativearrow_forward
arrow_back_ios
arrow_forward_ios
Recommended textbooks for you
- MATLAB: An Introduction with ApplicationsStatisticsISBN:9781119256830Author:Amos GilatPublisher:John Wiley & Sons Inc
 Probability and Statistics for Engineering and th...StatisticsISBN:9781305251809Author:Jay L. DevorePublisher:Cengage Learning
 Statistics for The Behavioral Sciences (MindTap C...StatisticsISBN:9781305504912Author:Frederick J Gravetter, Larry B. WallnauPublisher:Cengage Learning
  Elementary Statistics: Picturing the World (7th E...StatisticsISBN:9780134683416Author:Ron Larson, Betsy FarberPublisher:PEARSON
 The Basic Practice of StatisticsStatisticsISBN:9781319042578Author:David S. Moore, William I. Notz, Michael A. FlignerPublisher:W. H. Freeman
 Introduction to the Practice of StatisticsStatisticsISBN:9781319013387Author:David S. Moore, George P. McCabe, Bruce A. CraigPublisher:W. H. Freeman
MATLAB: An Introduction with Applications
Statistics
ISBN:9781119256830
Author:Amos Gilat
Publisher:John Wiley & Sons Inc
Probability and Statistics for Engineering and th...
Statistics
ISBN:9781305251809
Author:Jay L. Devore
Publisher:Cengage Learning
Statistics for The Behavioral Sciences (MindTap C...
Statistics
ISBN:9781305504912
Author:Frederick J Gravetter, Larry B. Wallnau
Publisher:Cengage Learning
Elementary Statistics: Picturing the World (7th E...
Statistics
ISBN:9780134683416
Author:Ron Larson, Betsy Farber
Publisher:PEARSON
The Basic Practice of Statistics
Statistics
ISBN:9781319042578
Author:David S. Moore, William I. Notz, Michael A. Fligner
Publisher:W. H. Freeman
Introduction to the Practice of Statistics
Statistics
ISBN:9781319013387
Author:David S. Moore, George P. McCabe, Bruce A. Craig
Publisher:W. H. Freeman