
Related questions
Concept explainers
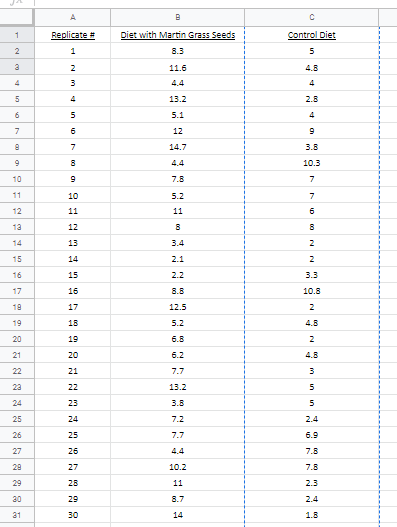
Attached is the data set:
Hint: to perform the analysis, the easiest way is to copy and paste the data into MS Excel and use the Data Analysis ToolPak to perform the requested calculations. Assume the treatment groups have equal variance.
Answer to 3 decimals unless otherwise specified.
All of these numbers are generated in the Data Analysis ToolPak:
= mean weight of treatment group
= mean weight of control group
= variance of treatment group
= variance of control group
= pooled variance
= degrees of freedom (whole number)
= calculated t statistic reported by the data analysis tool pack (NOTE: t statistic should always be a positive number)
= P value reported by the data analysis tool pack (answer to 3 significant figures)
= critical reported by the data analysis tool pack.
Based on this, would you reject or fail to reject the null hypothesis?
As a result of this experiment, researchers would or would not expect mice in fields with Martin Grass to weigh more than mice in fields without Martin Grass.


Trending nowThis is a popular solution!

Step by stepSolved in 2 steps with 5 images


- Why is the combination of the measures of central tendency and measures of variation so informative about a data set? Explain how they work together to provide a complete picture.arrow_forwardWhat is the most significant independent variable? Smoker Age Blood Pressurearrow_forwardWrite an example of a research study that would be most appropriate for a within subjects ANOVAarrow_forward
- true or false MSBetween represents the variability that is only affected by unsystematic factors.arrow_forwardWhich of the following are the names commonly used for the variable Y in sample regression? 1. covariate variable 2. independent variable 3. predictor variable 4. Explained variable 5. Response variable 6. explanatory variable 7. Predicted variable 8. Dependent variable 9. Criterion variablearrow_forwardhow to find the Variance for CBT and variance for BT,show step by step pleasearrow_forward
- The variance in a production process is an importance measure of the quality of the process. A large variance often signals an opprotunity for improvement in the process by finding ways to reduce the process variance. The conduct a statistical test to determine whether there is a significant differeence between the variance in the bag weights for two machines. Use a 0.05 level of significance. What is your conclusion? Which machine, if either, provides the greater opportunity for quality improvements? Machine 1 Machine 2 2.95 3.22 3.45 3.30 3.50 3.34 3.75 3.28 3.48 3.29 3.26 3.25 3.33 3.30 3.20 3.27 3.16 3.38 3.20 3.34 3.22 3.35 3.38 3.19 3.90 3.35 3.36 3.05 3.25 3.36 3.28 3.28 3.20 3.30 3.22 3.28 2.98 3.30 3.45 3.20 3.70 3.16 3.34 3.33 3.18 3.35 3.12 Please use excelarrow_forwardThe goal of analysis of variance (ANOVA) is toa. detect differences in treatment variances (or variances for different populations).b. detect differences in treatment means (or means for different populations).c. analyze the average variances for different populations.d. analyze the variances of the variances for different populations.arrow_forwardDefine ADL or GLS: Bias versus variance?arrow_forward
- The accompanying table lists pulse rates. Use a 0.05 significance level and apply the methods of two-way analysis of variance. What is the conclusion? Click on the icon to view the data table. C State the null and alternative hypotheses in the test for the effect of an interaction between row and column factors. Ho: There is no interaction between gender and age. H₁: There is an interaction between gender and age. What is the value of the test statistic for this test? F = 3.32 (Round to two decimal places as needed.) What is the corresponding P-value of the test statistic, F, for this P-value= (Round to three decimal places as needed.) Pulse Rates for Gender and Age Over 30 Years of Age Under 30 Years of Age Female 78 103 78 63 61 98 81 98 91 95 77 75 73 65 71 78 61 71 74 55 Female Male 60 81 56 69 68 74 75 68 63 56 46 70 61 65 91 80 59 58 64 59 Male D Xarrow_forwardplease assist I am lostarrow_forwardPeriodically, customers of a financial services company are asked to evaluate the company's financial consultants and services. Higher ratings on the client satisfaction survey indicate better service, with 7 the maximum service rating. Independent samples of service ratings for two financial consultants are summarized here. Consultant A has 10 years of experience, whereas consultant B has 1 year of experience. Use a = 0.05 and test to see whether the consultant with more experience has the higher population mean service rating. Assume the population variances are unequal. Consultant A Consultant B n1 = 16 n2 10 X1 = 6,81 X2 = 6.25 %3D S1 = 0.68 S2 = 0.75 (a) State the null and alternative hypotheses. O Hoi H1 - H2 = 0 Hai H1- Hz>0 O Ho: H1 - 42 = 0 Hại H1 - H2# 0 O Ho: H1 - H2 > 0 %3D Ha: H1 - H2 = 0 O Ho: H1 - Hz # 0 Hai Hy - Hz = 0 Hoi H1 - H2 = Hai H1- H2 = 0 (b) Compute the value of the test statistic. (Round your answer to three decimal places.) 19.191 (c) What is the p-value?…arrow_forward
- MATLAB: An Introduction with ApplicationsStatisticsISBN:9781119256830Author:Amos GilatPublisher:John Wiley & Sons Inc
 Probability and Statistics for Engineering and th...StatisticsISBN:9781305251809Author:Jay L. DevorePublisher:Cengage Learning
 Statistics for The Behavioral Sciences (MindTap C...StatisticsISBN:9781305504912Author:Frederick J Gravetter, Larry B. WallnauPublisher:Cengage Learning
  Elementary Statistics: Picturing the World (7th E...StatisticsISBN:9780134683416Author:Ron Larson, Betsy FarberPublisher:PEARSON
 The Basic Practice of StatisticsStatisticsISBN:9781319042578Author:David S. Moore, William I. Notz, Michael A. FlignerPublisher:W. H. Freeman
 Introduction to the Practice of StatisticsStatisticsISBN:9781319013387Author:David S. Moore, George P. McCabe, Bruce A. CraigPublisher:W. H. Freeman