
MATLAB: An Introduction with Applications
6th Edition
ISBN: 9781119256830
Author: Amos Gilat
Publisher: John Wiley & Sons Inc
expand_more
expand_more
format_list_bulleted
Related questions
Question
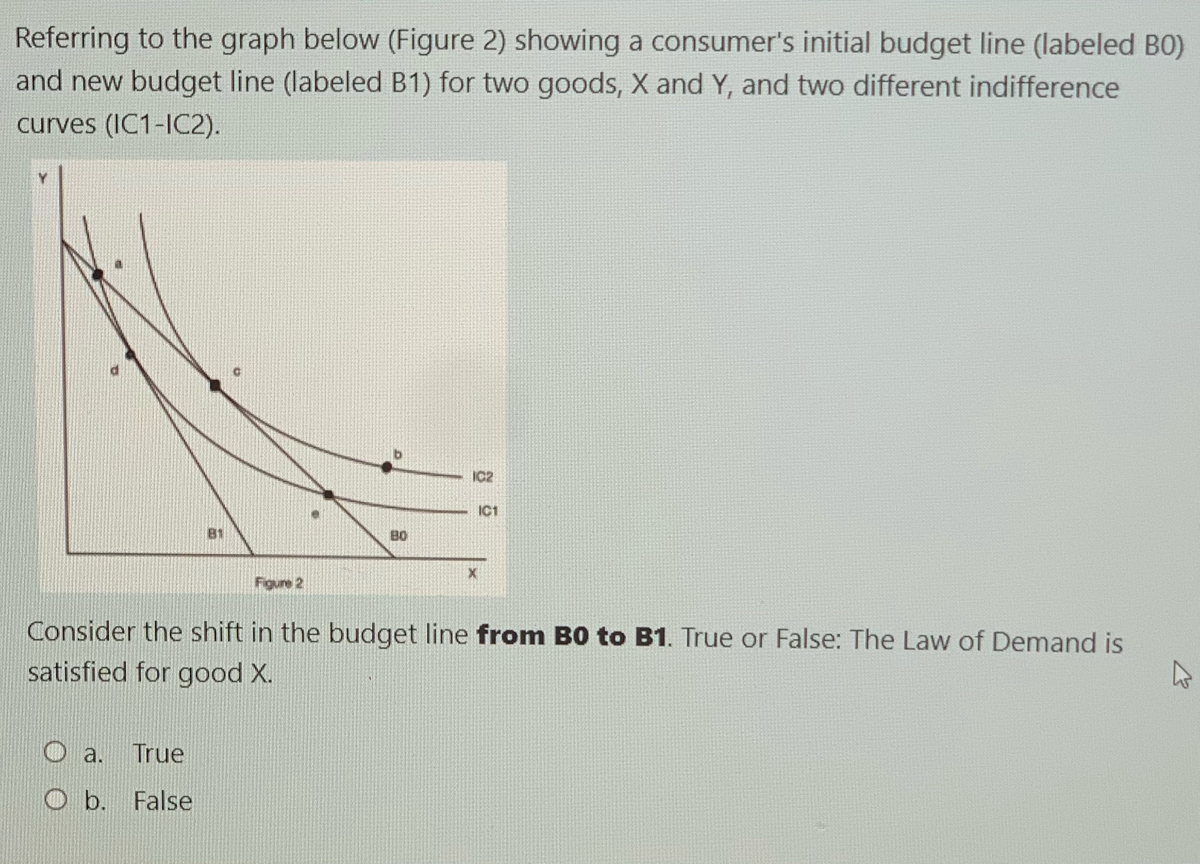

Transcribed Image Text:Referring to the graph below (Figure 2) showing a consumer's initial budget line (labeled BO)
and new budget line (labeled B1) for two goods, X and Y, and two different indifference
curves (IC1-IC2).
IC1
B1
B0
Figure 2
Consider the shift in the budget line from B0 to B1. True or False: The Law of Demand is
satisfied for good X.
Oa.
True
O b. False

Transcribed Image Text:b.
IC2
IC1
B1
B0
Figure 2
Expert Solution
This question has been solved!
Explore an expertly crafted, step-by-step solution for a thorough understanding of key concepts.

Step by stepSolved in 2 steps with 2 images

Knowledge Booster

Similar questions
- 1. The yearly data have been published showing the number of releases for each of the commercial movie studios and the gross receipts for those studios thus far. No. of releases (x) 361 270 306 22 35 10 8 12 21 Gross receipts (y) (million $)| 3844 1962 1371 1064 334 241 188 154 125 (a) Based on these data, can it be concluded that there is a linear relationship between the number of releases and the gross receipts? (b) Find y' when x = 200 new releases (c) Find the 95% prediction interval when x = 200 new releases 2. An economics student wishes to see if there is a relationship between the amount of state debt per capita and the amount of tax per capita at the state level. Per capita debt (x) 1924 907 1445 1608 661 Per capita tax (y) 1685 1838 1734 1842 1317 (a) Based on the data, can they conclude that per capita state debt and per capita state taxes are related? Both amounts are in dollars and represent five randomly selected states. (b) Find y' when x = $1500 in per capita debt (c)…arrow_forward1. The information in the following table shows the amount of sales and the profit from a small retail business in Whitby Ontario for the last 15 years. The years have not been provided as you will only need the amounts. Sales ($) (thousands) Profit ($) (thousands) 195 10 205 15 225 22 240 -10 255 25 300 39 265 24 345 55 295 32 335 37 380 48 405 55 355 50 390 48 410 55 a) Create a scatter plot of the data. Identify any outliers, if they occur. b) Sketch the line of best fit and determine its equation. A c) Describe any correlation you see between the variables. What conclusion could someone make based on the scatter plot? ( d) Identify whether you would use interpolation or extrapolation to predict the profit for the sales amount $500,000 and $230,000. e) Predict the profit for the sales amount $500,000 and $230,000.arrow_forwardQ3B All Fresh Seafood is a wholesale fish company based on the east coast of the U.S. Catalina Offshore Products is a wholesale fish company based on the west coast of the U.S. Table #9.2.5 contains prices from both companies for specific fish types ("Seafood online," 2013) ("Buy sushi grade," 2013). Data is in following table: Fish All Fresh Seafood Prices Catalina Offshore Products Prices Cod 19.99 17.99 Tilapi 6.00 13.99 Farmed Salmon 19.99 22.99 Organic Salmon 24.99 24.99 Grouper Fillet 29.99 19.99 Tuna 28.99 31.99 Swordfish 23.99 23.99 Sea Bass 32.99 23.99 Striped Bass 29.99 14.99 Do the data provide enough evidence to show that a west coast fish wholesaler is more expensive than an east coast wholesaler? Test at the 5% level. (iv) Determine sample mean of differences x⎯⎯div Determine sample mean of differences x¯d Enter in decimal form to nearest ten-thousandth. Examples of correctly…arrow_forward
- Exercise 2. Marginal and Conditional Relationships can be Very Different. For 100 mild cases of eczema, a new treatment had a higher cure rate than the old treatment (33.3% of 90 vs. 20% of 10). For 100 severe cases of eczema, again the new treatment had a higher cure rate than the old treatment (60% of 20 vs. 50% of 80). Over all 200 eczema cases, however, the old treatment had a higher cure rate than the new treatment- i.e. Simpson's Paradox strikes again. (a) Compute the overall cure rates for the new and old treatments. (b) Which treatment, old or new, would you choose and why?arrow_forwardThe Camera Shop sells two popular models of digital SLR cameras (Camera A Price: 240, Camera B Price: 300). The sales of these products are not independent of each other, but rather if the price of one increase, the sales of the other will increase. In economics, these two camera models are called substitutable products. The store wishes to establish a pricing policy to maximize revenue from these products. A study of price and sales data shows the following relationships between the quantity sold (N) and prices (P) of each model: NA = 195 - 0.5PA + 0.35PB NB = 300 + 0.06PA - 0.5PB Construct a model for the total revenue and implement it on a spreadsheet. Develop a two-way data table to estimate the optimal prices for each product in order to maximize the total revenue. Vary each price from $250 to $500 in increments of $10. Max profit occurs at Camera A price of $ . Max profit occurs at Camera B price of $arrow_forward
arrow_back_ios
arrow_forward_ios
Recommended textbooks for you
- MATLAB: An Introduction with ApplicationsStatisticsISBN:9781119256830Author:Amos GilatPublisher:John Wiley & Sons Inc
 Probability and Statistics for Engineering and th...StatisticsISBN:9781305251809Author:Jay L. DevorePublisher:Cengage Learning
 Statistics for The Behavioral Sciences (MindTap C...StatisticsISBN:9781305504912Author:Frederick J Gravetter, Larry B. WallnauPublisher:Cengage Learning
  Elementary Statistics: Picturing the World (7th E...StatisticsISBN:9780134683416Author:Ron Larson, Betsy FarberPublisher:PEARSON
 The Basic Practice of StatisticsStatisticsISBN:9781319042578Author:David S. Moore, William I. Notz, Michael A. FlignerPublisher:W. H. Freeman
 Introduction to the Practice of StatisticsStatisticsISBN:9781319013387Author:David S. Moore, George P. McCabe, Bruce A. CraigPublisher:W. H. Freeman
MATLAB: An Introduction with Applications
Statistics
ISBN:9781119256830
Author:Amos Gilat
Publisher:John Wiley & Sons Inc
Probability and Statistics for Engineering and th...
Statistics
ISBN:9781305251809
Author:Jay L. Devore
Publisher:Cengage Learning
Statistics for The Behavioral Sciences (MindTap C...
Statistics
ISBN:9781305504912
Author:Frederick J Gravetter, Larry B. Wallnau
Publisher:Cengage Learning
Elementary Statistics: Picturing the World (7th E...
Statistics
ISBN:9780134683416
Author:Ron Larson, Betsy Farber
Publisher:PEARSON
The Basic Practice of Statistics
Statistics
ISBN:9781319042578
Author:David S. Moore, William I. Notz, Michael A. Fligner
Publisher:W. H. Freeman
Introduction to the Practice of Statistics
Statistics
ISBN:9781319013387
Author:David S. Moore, George P. McCabe, Bruce A. Craig
Publisher:W. H. Freeman