Holt Mcdougal Larson Pre-algebra: Student Edition 2012
1st Edition
ISBN: 9780547587776
Author: HOLT MCDOUGAL
Publisher: HOLT MCDOUGAL
expand_more
expand_more
format_list_bulleted
Question
thumb_up100%

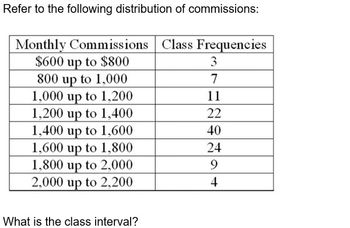
Transcribed Image Text:Refer to the following distribution of commissions:
Monthly Commissions Class Frequencies
$600 up to $800
800 up to 1,000
1,000 up to 1,200
1,200 up to 1,400
1,400 up to 1,600
1,600 up to 1,800
1,800 up to 2,000
2,000 up to 2,200
What is the class interval?
3
7
11
22
40
24
9
4

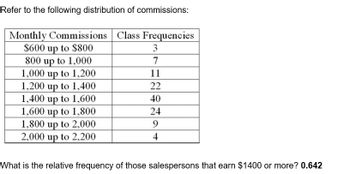
Transcribed Image Text:Refer to the following distribution of commissions:
Monthly Commissions Class Frequencies
$600 up to $800
800 up to 1,000
1,000 up to 1,200
1,200 up to 1,400
1,400 up to 1,600
1,600 up to 1,800
1,800 up to 2,000
2,000 up to 2,200
3
7
11
22
40
24
9
4
What is the relative frequency of those salespersons that earn $1400 or more? 0.642
Expert Solution
This question has been solved!
Explore an expertly crafted, step-by-step solution for a thorough understanding of key concepts.
This is a popular solution
Trending nowThis is a popular solution!
Step by stepSolved in 2 steps with 2 images

Knowledge Booster
Similar questions
- Find the mean hourly cost when the cell phone described above is used for 240 minutes.arrow_forward3)The following table shows data for the price of gasolince (per gallon) in various gasstations in a city. Complete the frequency table and anwer the following questions?Round to the nearest tenth of a percent if necessary.Price of Gas FrequencyCumulativeFrequencyRelativeFrequency0.00-0.99 11.00-1.99 12 132.00-2.993.00-3.99 19 594.00-4.99 625.00-5.99 63a.) What percent of the stations have price of gasoline at least $3 per gal? Round to thenearest tenth of a percent if necessary.b.) Find the mean price of gasoline? Round to the nearest cent if necessary.arrow_forwardMolly's Candle Shop has several retail stores in the coastal areas of North and South Carolina. Many of Molly's customers ask her to ship their purchases. The following chart shows the number of packages shipped per day for the last 100 days.a. What is the total number of frequencies?b.What is the class interval?c.What is the class frequency for the 20 to 25 class?d.What is the relative frequency of the 20 up to 25 class? (Round your answer to 2 decimal places.)e. What is the midpoint of the 0 up to 5 class? (Round your answer to 1 decimal place.)f. On how many days were there 20 or more packages shipped?arrow_forward
- Task of the day: The credit office of a departmental store gave the following statements for payment due to 40 customers. Construct a frequency table of the balances due taking the class intervals as Dollar 50 and under Dollar 200, Dollar 200 and under Dollar 350, etc. Also find the percentage cumulative frequencies and jinterpret these values.arrow_forwardGrand Canyon...arrow_forwardThe following data represent the heights (in inches) of 14 students in Ms. Warner's math class: 65, 63, 68, 59, 74, 59, 68, 61, 64, 60, 69, 72, 55, 64. Complete the table Interval Frequency 55-58 59-62 63-66 67-70 71-74arrow_forward
- The following is the number of minutes to commute from home to work for a group of 25 automobile executives. 51 29 30 34 44 27 52 24 57 31 40 45 40 43 40 36 39 36 48 42 39 43 48 38 33 a. How many classes would you recommend? b. What class interval would you suggest?arrow_forwardThe amounts (in dollars) paid by 20 students for textbooks during the fall term are given on the right. Determine the frequencies of the class intervals for this data. 21 43 29 55 28 36 26 51 63 61 23 48 61 59 36 41 28 53 66 59 ..... Fill in the correct frequencies in the frequency table based on the data. Interval (in Dollars) Frequency 20-29 30-39 40-49 50-59 60-69arrow_forwardUse eight intervals, starting with 0-19. Perform the following. a. Group the data as indicated. b. Prepare a frequency distribution with a column for intervals and frequencies. c. Construct a histogram. d. Construct a frequency polygon. 13 106 115 71 127 26 27 44 127 81 55 137 44 71 63 142 76 73 123 12 44 35 85 81 2 98 84 96 91 37 86 145 33 82 12 101 a. Tally the given data falling into each interval. Choose the correct table below. O A. 0-19 I 20-39 uI 40-59 HII 60–79 HII 80-99 uI 100–119 H| 120-139 I 140–159 I||| Interval Tally OB. Interval Tally OC. Interval Tally 0-19 0-19 20-39 |II 40-59 HI 60–79 | 80-99 |I 100–119 |III 120–139 || 20-39 40-59 60-79 80-99 100–119 ||| 120-139 |||| 140–159 || 140–159arrow_forward
- Use the following table: $ 210 290 286 $ 505 480 410 $ 310 550 305 $ 380 490 $ 275 444 200 368 Prepare a frequency distribution from the above weekly salaries of teachers at Moore Community College. Use the following intervals: Salaries $200-$299.99 ces 300-399.99 400-499.99 500-599.99 Frequencyarrow_forwardThe ungrouped frequency table below shows the number of students absent in a statistics class in a fall semester. (click to select) V a. Is it possible to recover the raw data from this table? Number Absent Number of Classes 3 3 5 8 0 1 2 3 4 5 6 b. What is the total number of absenteeism recorded in the course that semester? c. What number of absent students occurred most often? d. In how many classes were 2 students absent? 6 3 3 e. How many times were no more than 2 students absent? % Round to two decimal places f. How many times were more than 4 students absent? g. What proportion of classes were exactly 4 students absent? % Round to two decimal places h. What proportion of classes were up to 3 students absent? % i. What proportion of classes were more than 3 students absent?arrow_forwardForty randomly selected people were asked the number of people living in their home. Let X = the number of people living in one home. The results are as follows: (3 points each) X Frequency Relative Frequency 1 2 2 5 3 8 4 12 5 12 6 0 7 1 a. Complete the frequency table. B. What percent of the people that have at least 5 people living in their home?arrow_forward
arrow_back_ios
SEE MORE QUESTIONS
arrow_forward_ios
Recommended textbooks for you
 Holt Mcdougal Larson Pre-algebra: Student Edition...AlgebraISBN:9780547587776Author:HOLT MCDOUGALPublisher:HOLT MCDOUGAL
 Glencoe Algebra 1, Student Edition, 9780079039897...AlgebraISBN:9780079039897Author:CarterPublisher:McGraw Hill
 Algebra: Structure And Method, Book 1AlgebraISBN:9780395977224Author:Richard G. Brown, Mary P. Dolciani, Robert H. Sorgenfrey, William L. ColePublisher:McDougal Littell
 College Algebra (MindTap Course List)AlgebraISBN:9781305652231Author:R. David Gustafson, Jeff HughesPublisher:Cengage Learning

Holt Mcdougal Larson Pre-algebra: Student Edition...
Algebra
ISBN:9780547587776
Author:HOLT MCDOUGAL
Publisher:HOLT MCDOUGAL

Glencoe Algebra 1, Student Edition, 9780079039897...
Algebra
ISBN:9780079039897
Author:Carter
Publisher:McGraw Hill

Algebra: Structure And Method, Book 1
Algebra
ISBN:9780395977224
Author:Richard G. Brown, Mary P. Dolciani, Robert H. Sorgenfrey, William L. Cole
Publisher:McDougal Littell

College Algebra (MindTap Course List)
Algebra
ISBN:9781305652231
Author:R. David Gustafson, Jeff Hughes
Publisher:Cengage Learning