ENGR.ECONOMIC ANALYSIS
14th Edition
ISBN: 9780190931919
Author: NEWNAN
Publisher: Oxford University Press
expand_more
expand_more
format_list_bulleted
Question
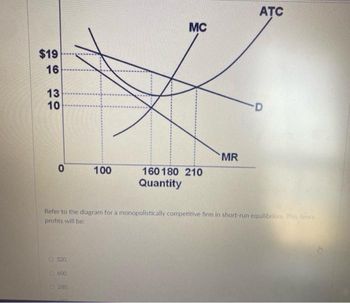
$19 16 13 10 0 320. O 600. 100 280. MC 160180 210 Quantity MR Refer to the diagram for a

Transcribed Image Text:$19
16
13
10
0
320
600.
100
280.
MC
160180 210
Quantity
MR
Refer to the diagram for a monopolistically competitive firm in short-run equilibrium. This firm's
profits will be:
ATC
-D
Expert Solution
This question has been solved!
Explore an expertly crafted, step-by-step solution for a thorough understanding of key concepts.
This is a popular solution
Trending nowThis is a popular solution!
Step by stepSolved in 3 steps with 2 images

Knowledge Booster
Similar questions
- The graph displays the cost and revenue curves associated with a monopolistically competitive firm. This firm will produce _____ units and charge a price of ____. a. 60; $45 b. 90; $40 c. 80; $30 d. 80; $60arrow_forwardSuppose the figure to the right shows the demand curve for a monopolistically competitive firm. Show the firm's marginal revenue curve. 20- 18- Using the line drawing tool, graph the firm's marginal revenue curve. Label this curve "MR." 16- Carefully follow the instructions above, and only draw the required object. 14- 12- 10- 8- 6- 4- 2- 20 Quantity 12 16 24 28 32 36 40 Price (dollars per unit)arrow_forward9arrow_forward
- AUse the graph below to explain the output, profit and loss conditions for monopolistically competitive firms. Show your work where appropriate in reference to the Graph. Firm Lan T-shirt monopolistic competitive firm Price MC k ATC 25 25 ÁTC 15 DD 10 5 MR 10 30 40 50 60 70 80 90 Supply B.With examples, examine the barriers to business entry for imperfect competition firms 20 20arrow_forwardF3.arrow_forwardSuppose that a firm produces wool jackets in a monopolistically competitive market. The following graph shows its demand curve, marginal revenue (MR) curve, marginal cost (MC) curve, and average total cost (ATC) curve. Place a black point (plus symbol) on the graph to indicate the long-run monopolistically competitive equilibrium price and quantity for this firm. Next, place a grey point (star symbol) to indicate the minimum average total cost the firm faces and the quantity associated with that cost. (?) PRICE (Dollars perjacket) 100 90 80 70 60 50 40 30 20 10 0 0 MC 10 ATC MR 20 30 40 50 80 70 QUANTITY (Thousands of jackets) 80 Demand 90 100 O F ++ Mon Comp Outcome Min Unit Cost hp earrow_forward
- 7. The diagram below shows the demand and cost situation of a firm in a monopolistically competitive industry. 15 12 t1 e 18 20 40 so 60 70 60 10 10 110 120 1 140 150 sED 170 180 a. What output will this firm choose? Why? b. What price will it charge? Why? c. What is total revenue and total cost at the profit maximizing output? (E) al na pur aarrow_forwardATC P1 P2 P3 P4 MR Q4 Q3 Quantity Qi Q2 What is the profit maximizing output for the monopolistic competitor? O Q3 O Q4 OQ1 O Q2 Pricearrow_forwardThe graph below is for Chic and Sharpe Ltd., a firm in the women's garment industry, which is monopolistically competitive. Cost and revenues 70 60 50 40 30 10 0 Seleg v Select Quantity per period Select Select v 10 20 30 40 50 60 70 80 90 O Search Prev 1 of 6 HHH Next >arrow_forward
- MN 00 工 25 Price %24 For the monopolistically competitive firm in the following figure, the profit-maximizing price is and the quantity is MC ATC 32 20 Demand MR Quantity O $20; 25 O $16; 25 O $32; 25 O $20; 40 10:12 PM 75°F ENG earch 12/12/2021 f12 Ins prt sc delete home 61 pua f5 dn 6d f4 84 114 144 米 backspace lock 4. 5. R. home enter 4. K. pause ↑ shift end 2. C. alt ctrlarrow_forwardk Onli.... s 15 10) Below are drawn cost curves for a monopolistically competitive firm. What is the profit? 16 14 812 10 Dollars 0 MC MR 20 23 25 30 Number of haircuts ATC 9 Darrow_forward$19 16 30 13 10 O 100 Multiple Choice 160180 210 Quantity loss of $320. profit of $480. MC Refer to the diagram for a monopolistically competitive firm in short-run equilibrium. This firm will realize an economic profit of $280. profit of $600. MR ATC Darrow_forward
arrow_back_ios
SEE MORE QUESTIONS
arrow_forward_ios
Recommended textbooks for you

 Principles of Economics (12th Edition)EconomicsISBN:9780134078779Author:Karl E. Case, Ray C. Fair, Sharon E. OsterPublisher:PEARSON
 Engineering Economy (17th Edition)EconomicsISBN:9780134870069Author:William G. Sullivan, Elin M. Wicks, C. Patrick KoellingPublisher:PEARSON
 Principles of Economics (MindTap Course List)EconomicsISBN:9781305585126Author:N. Gregory MankiwPublisher:Cengage Learning
 Managerial Economics: A Problem Solving ApproachEconomicsISBN:9781337106665Author:Luke M. Froeb, Brian T. McCann, Michael R. Ward, Mike ShorPublisher:Cengage Learning
 Managerial Economics & Business Strategy (Mcgraw-...EconomicsISBN:9781259290619Author:Michael Baye, Jeff PrincePublisher:McGraw-Hill Education


Principles of Economics (12th Edition)
Economics
ISBN:9780134078779
Author:Karl E. Case, Ray C. Fair, Sharon E. Oster
Publisher:PEARSON

Engineering Economy (17th Edition)
Economics
ISBN:9780134870069
Author:William G. Sullivan, Elin M. Wicks, C. Patrick Koelling
Publisher:PEARSON

Principles of Economics (MindTap Course List)
Economics
ISBN:9781305585126
Author:N. Gregory Mankiw
Publisher:Cengage Learning

Managerial Economics: A Problem Solving Approach
Economics
ISBN:9781337106665
Author:Luke M. Froeb, Brian T. McCann, Michael R. Ward, Mike Shor
Publisher:Cengage Learning

Managerial Economics & Business Strategy (Mcgraw-...
Economics
ISBN:9781259290619
Author:Michael Baye, Jeff Prince
Publisher:McGraw-Hill Education