
MATLAB: An Introduction with Applications
6th Edition
ISBN: 9781119256830
Author: Amos Gilat
Publisher: John Wiley & Sons Inc
expand_more
expand_more
format_list_bulleted
Related questions
Question
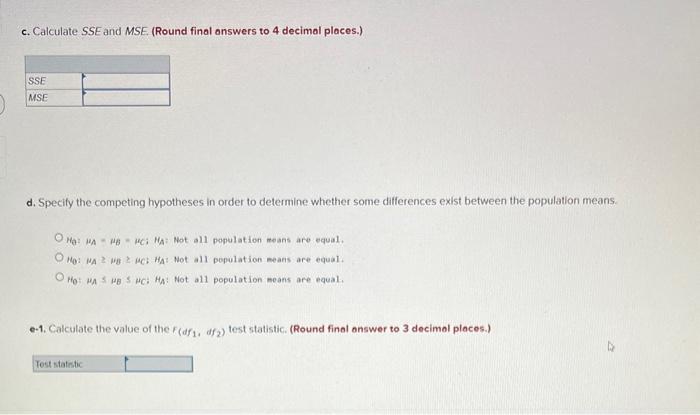

Transcribed Image Text:c. Calculate SSE and MSE. (Round final answers to 4 decimal places.)
SSE
MSE
d. Specify the competing hypotheses in order to determine whether some differences exist between the population means.
OHG: MAHB MC MA: Not all population means are equal.
OMG: MA 2 MB 2 MC HA: Not all population means are equal.
OHO: MA 5 HB 5 PC: HA: Not all population means are equal.
e-1. Calculate the value of the F(df1, df2) test statistic. (Round final answer to 3 decimal places.)
Test statistic

Transcribed Image Text:Random sampling from four normally distributed populations produced the following data: (You may find it useful to reference the E
table.)
A
-10
-15
-18
Treatments
B
-17
-8
-13
-12
SSTR
MSTR
Grand mean
C
-6
-13
-4
-10
-15
picture Click here for the Excel Data File
a. Calculate the grand mean. (Negative value should be indicated by a minus sign. Round your answer to 2 decimal places.)
D
-13
-12
-7
b. Calculate SSTR and MSTR. (Round final answers to 4 decimal places.)
Expert Solution
This question has been solved!
Explore an expertly crafted, step-by-step solution for a thorough understanding of key concepts.

This is a popular solution

Trending nowThis is a popular solution!

Step by stepSolved in 5 steps

Knowledge Booster

Similar questions
- Find the mean, median, and mode(s) of the data in the following stem-and-leaf plot. The leaf represents the ones digit. 2 1 46 Part 1 of 3 Find the mean. Round your answer to one decimal place, if necessary. Mean: X Part 2 of 3 Find the median. Round your answer to one decimal place, if necessary. Median: S Part 3 of 3 Find the mode(s). If there is more than one, separate them with commas. O There is no mode. O There is at least one mode. 00.... Mode(s): 4799 X Ś Españolarrow_forwardApproximate the mean for the following data set. Round your answer to one decimal place. \table[[Class,, Frequency ],[0-13,,4],[14-27,, 14], [28-41,, 7], [42-55, 10,], [56-69 The mean is approximatelyarrow_forwardWhat is the best description of the shape of the data below? Bell-shaped Skewed right Skewed leftarrow_forward
- Use the normal distribution of SAT critical reading scores for which the mean is 505 and the standard deviation is 122. Assume the variable x is normally distributed. (a) What percent of the SAT verbal scores are less than 550? (b) If 1000 SAT verbal scores are randomly selected, about how many would you expect to be greater than 525? ..... (a) Approximately % of the SAT verbal scores are less than 550. (Round to two decimal places as needed.)arrow_forwardThe table below shows the frequency of AP Physics scores for a high school class. AP Score Frequency 1 4. 6. 3 4 Find the mean and median. O Mean = 1.67 and Median 2 Mean 5 and Median = 4 Mean 3 and Median Mean 3 and Median = 3 Mean 5 and Median 3arrow_forwardApproximate the mean of the grouped data. Round to the nearest whole number. Phone calls (per day) Frequency 8-11 26 12-15 25 16-19 44 20-23 13 24-27 38 ... Question content area right Part 1 A.16 16 B.29 29 C.18 18 D.17 17 E.19arrow_forward
arrow_back_ios
arrow_forward_ios
Recommended textbooks for you
- MATLAB: An Introduction with ApplicationsStatisticsISBN:9781119256830Author:Amos GilatPublisher:John Wiley & Sons Inc
 Probability and Statistics for Engineering and th...StatisticsISBN:9781305251809Author:Jay L. DevorePublisher:Cengage Learning
 Statistics for The Behavioral Sciences (MindTap C...StatisticsISBN:9781305504912Author:Frederick J Gravetter, Larry B. WallnauPublisher:Cengage Learning
  Elementary Statistics: Picturing the World (7th E...StatisticsISBN:9780134683416Author:Ron Larson, Betsy FarberPublisher:PEARSON
 The Basic Practice of StatisticsStatisticsISBN:9781319042578Author:David S. Moore, William I. Notz, Michael A. FlignerPublisher:W. H. Freeman
 Introduction to the Practice of StatisticsStatisticsISBN:9781319013387Author:David S. Moore, George P. McCabe, Bruce A. CraigPublisher:W. H. Freeman
MATLAB: An Introduction with Applications
Statistics
ISBN:9781119256830
Author:Amos Gilat
Publisher:John Wiley & Sons Inc
Probability and Statistics for Engineering and th...
Statistics
ISBN:9781305251809
Author:Jay L. Devore
Publisher:Cengage Learning
Statistics for The Behavioral Sciences (MindTap C...
Statistics
ISBN:9781305504912
Author:Frederick J Gravetter, Larry B. Wallnau
Publisher:Cengage Learning
Elementary Statistics: Picturing the World (7th E...
Statistics
ISBN:9780134683416
Author:Ron Larson, Betsy Farber
Publisher:PEARSON
The Basic Practice of Statistics
Statistics
ISBN:9781319042578
Author:David S. Moore, William I. Notz, Michael A. Fligner
Publisher:W. H. Freeman
Introduction to the Practice of Statistics
Statistics
ISBN:9781319013387
Author:David S. Moore, George P. McCabe, Bruce A. Craig
Publisher:W. H. Freeman