
MATLAB: An Introduction with Applications
6th Edition
ISBN: 9781119256830
Author: Amos Gilat
Publisher: John Wiley & Sons Inc
expand_more
expand_more
format_list_bulleted
Related questions
Question
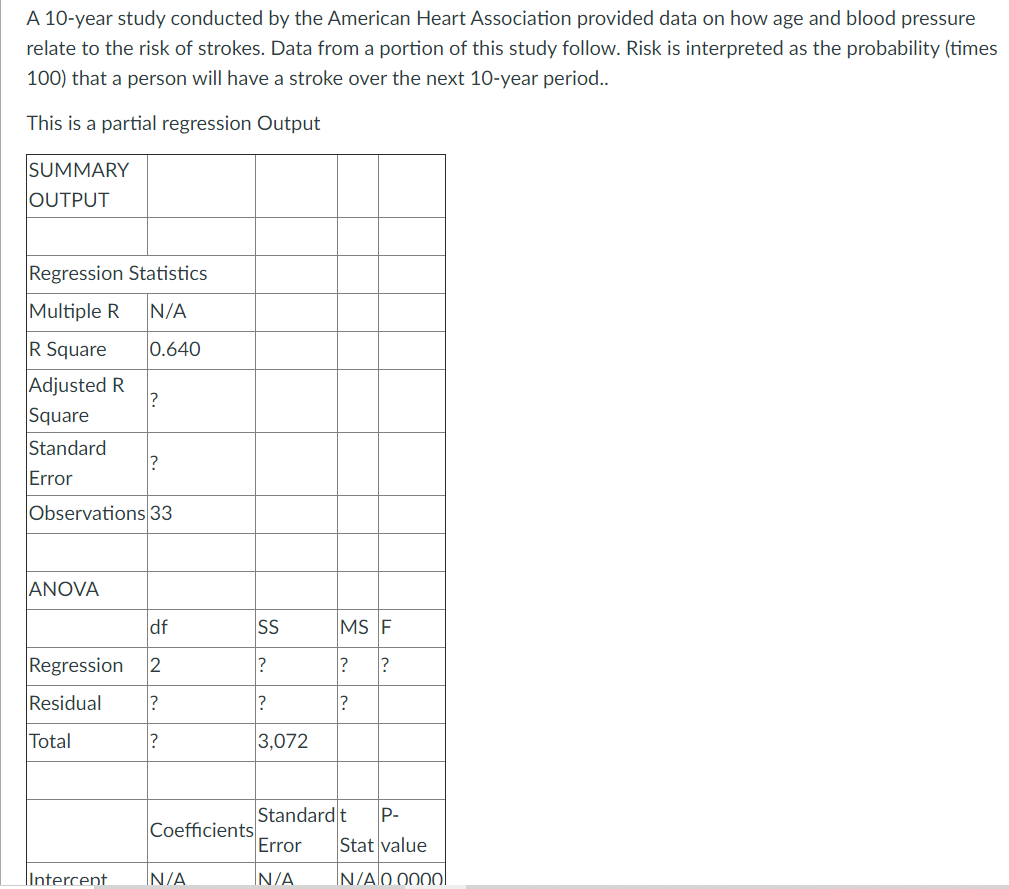

Transcribed Image Text:A 10-year study conducted by the American Heart Association provided data on how age and blood pressure
relate to the risk of strokes. Data from a portion of this study follow. Risk is interpreted as the probability (times
100) that a person will have a stroke over the next 10-year period..
This is a partial regression Output
SUMMARY
OUTPUT
Regression Statistics
Multiple R
N/A
R Square
0.640
Adjusted R
?
Square
Standard
?
Error
Observations 33
ANOVA
df
SS
MS F
Regression
2
?
Residual
Total
3,072
Standardt
P-
Coefficients
Error
Stat value
lIntercent.
N/A
N/A
IN/AlO 0000l

Transcribed Image Text:Observations 33
ANOVA
df
SS
MS F
Regression
?
Residual
?
Total
?
3,072
Standard t
Coefficients
Error
P-
Stat value
Intercept
N/A
N/A
N/A 0.0000
Age
N/A
N/A
N/A 0.0000
Pressure
N/A
N/A
N/A 0.0000
SST = 3,072
R Square = 0.640
Observations = 33
Compute the F test statistic
If needed round your intermediate calculations to no more than 3 decimal places.
Round your final answer to 3 decimal places.
Expert Solution
This question has been solved!
Explore an expertly crafted, step-by-step solution for a thorough understanding of key concepts.

Step by stepSolved in 3 steps

Knowledge Booster


Learn more about
Need a deep-dive on the concept behind this application? Look no further. Learn more about this topic, statistics and related others by exploring similar questions and additional content below.Similar questions
- The first picture is the question and the second is the ones that I need help with. Thanksarrow_forwardRound Round 3 100 MODE. to the nearest tenth place. to the nearest ten-thousandths place. V QUESTION 14 Choose to compare the decimals. -2.6 QUESTION 15 Click Save and Submit to save and submit. Click Save Alarrow_forwardCompute the P-value. Round the answer to four decimal places. P-value = X Sarrow_forward
- The accompanying table contains data on the weight, in grams, of a sample of 50 tea bags produced during an eight-hour shift. Complete parts (a) through (d). Click the icon to view the data table. (Round to two decimal places as needed.) Find the p-value. p-value = .819 (F State the conclusi Do not reject H b. Construct a 90 The 90% confider (Round to four de Interpret the 90% More Info Tea Bag Weight (in grams) 5.65 5.45 5.42 5.41 5.53 5.34 5.54 5.46 5.53 5.59 5.42 5.51 5.55 5.54 5.61 5.56 5.47 5.44 5.49 5.39 5.46 5.63 5.53 5.32 5.68 5.29 5.49 5.76 5.56 5.41 5.57 5.59 5.52 5.33 5.49 5.54 5.61 5.44 5.45 5.24 5.56 5.63 5.49 5.58 5.68 5.43 5.49 5.57 5.58 5.35 I Xarrow_forwardOnly round final answer (to 2 decimal places). Please report proportion as a decimal number, and not a percentagearrow_forwardLet TailTwo-Tail Right Tail samples - 1000 mean = 0.150 100 std. error - 0.027 80 60 40 20 0.06 0.08 0.10 0.12 0.14 0.16 0.18 0.20 0.22 0.24 0.15arrow_forward
- Help me with all of them pleasearrow_forwardyour car is more crowded than you think. table 5.8 reports results from a 1969 personal transportation survey on "home-to-work" trips in metropolitan areas. The survey stated that the average car occupancy was 1.4 people. check that calculation.arrow_forward
arrow_back_ios
arrow_forward_ios
Recommended textbooks for you
- MATLAB: An Introduction with ApplicationsStatisticsISBN:9781119256830Author:Amos GilatPublisher:John Wiley & Sons Inc
 Probability and Statistics for Engineering and th...StatisticsISBN:9781305251809Author:Jay L. DevorePublisher:Cengage Learning
 Statistics for The Behavioral Sciences (MindTap C...StatisticsISBN:9781305504912Author:Frederick J Gravetter, Larry B. WallnauPublisher:Cengage Learning
  Elementary Statistics: Picturing the World (7th E...StatisticsISBN:9780134683416Author:Ron Larson, Betsy FarberPublisher:PEARSON
 The Basic Practice of StatisticsStatisticsISBN:9781319042578Author:David S. Moore, William I. Notz, Michael A. FlignerPublisher:W. H. Freeman
 Introduction to the Practice of StatisticsStatisticsISBN:9781319013387Author:David S. Moore, George P. McCabe, Bruce A. CraigPublisher:W. H. Freeman
MATLAB: An Introduction with Applications
Statistics
ISBN:9781119256830
Author:Amos Gilat
Publisher:John Wiley & Sons Inc
Probability and Statistics for Engineering and th...
Statistics
ISBN:9781305251809
Author:Jay L. Devore
Publisher:Cengage Learning
Statistics for The Behavioral Sciences (MindTap C...
Statistics
ISBN:9781305504912
Author:Frederick J Gravetter, Larry B. Wallnau
Publisher:Cengage Learning
Elementary Statistics: Picturing the World (7th E...
Statistics
ISBN:9780134683416
Author:Ron Larson, Betsy Farber
Publisher:PEARSON
The Basic Practice of Statistics
Statistics
ISBN:9781319042578
Author:David S. Moore, William I. Notz, Michael A. Fligner
Publisher:W. H. Freeman
Introduction to the Practice of Statistics
Statistics
ISBN:9781319013387
Author:David S. Moore, George P. McCabe, Bruce A. Craig
Publisher:W. H. Freeman