
MATLAB: An Introduction with Applications
6th Edition
ISBN: 9781119256830
Author: Amos Gilat
Publisher: John Wiley & Sons Inc
expand_more
expand_more
format_list_bulleted
Related questions
Question

Transcribed Image Text:D
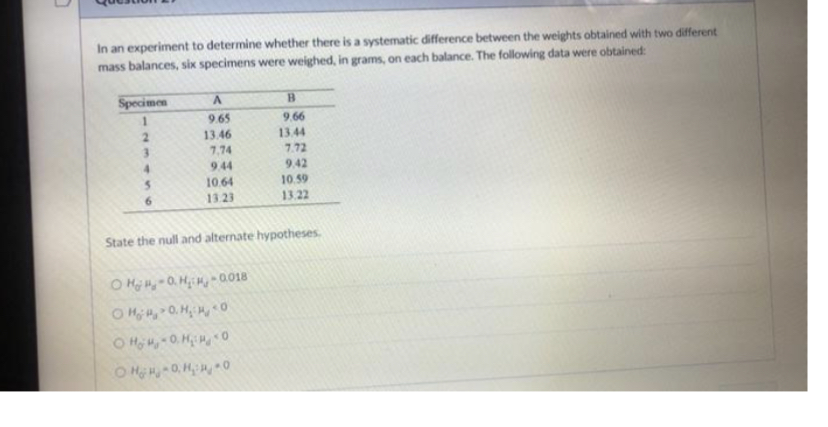
In an experiment to determine whether there is a systematic difference between the weights obtained with two different
mass balances, six specimens were weighed, in grams, on each balance. The following data were obtained:
Specimen
2
3
4
5
A
9.65
13.46
7.74
9.44
10.64
13.23
B
9.66
13.44
OHH-O.H₂H-0018
OHO.H₂H0
ⒸH₂-OH₂₂0
OHHOH₂O
7.72
9.42
10.59
13.22
State the null and alternate hypotheses.
Expert Solution
This question has been solved!
Explore an expertly crafted, step-by-step solution for a thorough understanding of key concepts.

This is a popular solution

Trending nowThis is a popular solution!

Step by stepSolved in 2 steps

Knowledge Booster

Similar questions
- e? what is the state alternative hypothesis?arrow_forwardConsider the following sample observations on stabilized viscosity of asphalt specimens. 2,762 2,907 3,012 2,813 2,876 Suppose that for a particular application, it is required that true average viscosity be 3,000. Does this requirement appear to have been satisfied? State the appropriate hypotheses. (Use ? = 0.05.) H0: ? > 3,000 Ha: ? < 3,000 H0: ? = 3,000 Ha: ? ≠ 3,000 H0: ? ≠ 3,000 Ha: ? = 3,000 H0: ? < 3,000 Ha: ? = 3,000 Calculate the test statistic and determine the P-value. (Round your test statistic to two decimal places and your P-value to three decimal places.) t = P-value = What can you conclude? Reject the null hypothesis. There is sufficient evidence to conclude that the true average is viscosity differs from 3000.Do not reject the null hypothesis. There is sufficient evidence to conclude that the true average is viscosity differs from 3000. Reject the null hypothesis. There is not sufficient evidence to conclude that…arrow_forward6:03 Consider the following data set that contains information about a sample of ten U.S. states in 2022 providing the gas price per gallon and price of a gallon of milk for each state. rice of a gallon of milk, [dollar: price of a gallon of milk (dollars) 1 4.08 2 4.12 3 4.25 4 4.31 5 4.33 6 4.4 7 4.69 8 4.71 9 4.81 10 4.95 The scatter plot that summarizes the data with regard to the gas price per gallon as the input variable and the price of a gallon of milk as the output variable is provided below. state gas price per gallon (dollars) 3.18 3.45 4.58 4.88 4.98 5.19 5.23 5.42 5.58 5.64 1 5 gas price per gallon, [dollars] a. Is there an association between the gas price per gallon and the price of a gallon of milk of a state? If yes, is it positive or negative? There appears to be Select an answer the two variables. myopenmath.com betweenarrow_forward
- In an experiment to determine whether there is a systematic difference between the weights obtained with two different mass balances, six specimens were weighed, in grams, on each balance. The following data were obtained: Specimen 1 10.16 10.17 10.88 10.87 10.49 10.48 5.29 5.28 8.25 8.26 7.58 7.54 State the null and alternate hypotheses. 234 56arrow_forwardFind the standardized test statistic t for a sample with n = 10, xbar= 12.7, s = 1.3, and α = 0.05 if H0: μ ≥ 13.6. Round your answer to three decimal placearrow_forwardLet n₁ = 50, X₁ = 40, n₂ = 50, and X₂ = 20. Complete parts (a) and (b) below. a. At the 0.05 level of significance, is there evidence of a significant difference between the two population proportions? Determine the null and alternative hypotheses. Choose the correct answer below. OA. Ho: ₁2π₂ H₁: π₁ π₂ C. Ho: π₁ #1₂ H1: П1 =П2 Calculate the test statistic, ZSTAT, based on the difference P₁ - P2. The test statistic, ZSTAT, is (Type an integer or a decimal. Round to two decimal places as needed.) Calculate the p-value. O D. Ho: ₁ = π₂ H₁: π₁ #π₂ 퍼 The p-value is. (Type an integer or a decimal. Round to three decimal places as needed.)arrow_forward
- The accompanying summary data on CeO₂ particle sizes (nm) under certain experimental conditions was read from a graph in an article. 4.0-<4.5 4.5-5.0 27 6.5-<7.0 3 34 7.0-<7.5 4 3.0-3.5 5 5.5-6.0 13. 3.5-4.0 16 6.0-6.5 8 (a) What proportion of the observations are less than 5? (Round your answer to three decimal places.) 0.617 O (b) What proportion of the observations are at least 6? (Round your answer to three decimal places.) 0.120 (c) Construct a histogram with relative frequency on the vertical axis. Percent Percent 25 25 20 20 15 15 10 10 5 5 O 3 4 5 6 7 8 Particle Size (nm). (d) Construct a histogram with density on the vertical axis. Density 0.5 0.4 0.3 0.2 0.1 r 3 4 5 6 7 8 5.0-<5.5 22 7.5-8.0 1 O Particle Size 3 (nm) O Density 0.5 0.4 0.3 0.2 0.1 4 5 6 7 Compare the density histogram to the histogram in part (c). O The density histogram is less symmetrical. 8 3 4 5 6 7 8 O The density histogram is more positively skewed. The density histogram is less negatively skewed. O Both…arrow_forwardA poll classified respondents by gender and political party, as shown in the table. A researcher wonders if gender and party affiliation are not independent. (Assume a significance level of α = 0.05) Complete parts a) through e) below. d) Find the P-value for this test. Calculate the chi-square statistic. x² = 2.339 (Round to three decimal places as needed.) Find the P-value for the test. Choose the correct answer below. 0.0823 0.3104 0.003 DRIO 40 40 25 Male Female 49 35 18 e) State an appropriate conclusion. Choose the correct answer below. O A. Fail to reject the null hypothesis. There is sufficient evidence to support the claim. B. Reject the null hypothesis. There is not sufficient evidence to support the claim. C. Reject the null hypothesis. There is sufficient evidence to support the claim. O D. Fail to reject the null hypothesis. There is not sufficient evidence to support the claim.arrow_forward3. An experiment is conducted to measure the flex (amount of bending) in a thin composite beam when placed under a known load (force). Smaller beams made of the same material will then be used as springs to protect electronics. The manufacturer needs the beam to flex on average 5.0 mm, with 95 % of all samples having a flex between 4.7 mm and 5.3 mm. After testing the flex of 20 samples, the following numbers are found: (d) (e) 20 (f) (g) i=1 Each sample has the flex measured to the nearest 0.1 mm using electronic calipers. (a) What is the mean flex found using 20 samples? What is the sample standard deviation of flex four using 20 samples? What is the 95% confidence interval for an individual sample? (Not true mean this time!) That is, in what range would we expect the flex of 95 % of the samples to be found? x₁ = 102.2 mm 20 Σχι" = 523.7 mm2 Xi i=1 Does the set of samples used satisfy the desired failure rate? Explain the reasoning behind your answer. What percent difference is there…arrow_forward
- Based on the following statistical statement, χ2(1, N = 92) = 4.52, p = .03, is there a significant association? Group of answer choices Yes Noarrow_forwardQn5. Using the Kruskal-Wallis test at a = 0.01, can we conclude that the three populations represented by the three samples differ with respect to propellant burning rates? A Summarized data is given as follows: For System I: n = 5, Sum of the ranks i.e., R = 58 For System II:n, = 6, Sum of the ranks i.e., R, = 24 For System III: n, = 8, Sum of the ranks i.e., R, = 87. %3! ( Given that Table value of Chi Square = 9.21)arrow_forward
arrow_back_ios
arrow_forward_ios
Recommended textbooks for you
- MATLAB: An Introduction with ApplicationsStatisticsISBN:9781119256830Author:Amos GilatPublisher:John Wiley & Sons Inc
 Probability and Statistics for Engineering and th...StatisticsISBN:9781305251809Author:Jay L. DevorePublisher:Cengage Learning
 Statistics for The Behavioral Sciences (MindTap C...StatisticsISBN:9781305504912Author:Frederick J Gravetter, Larry B. WallnauPublisher:Cengage Learning
  Elementary Statistics: Picturing the World (7th E...StatisticsISBN:9780134683416Author:Ron Larson, Betsy FarberPublisher:PEARSON
 The Basic Practice of StatisticsStatisticsISBN:9781319042578Author:David S. Moore, William I. Notz, Michael A. FlignerPublisher:W. H. Freeman
 Introduction to the Practice of StatisticsStatisticsISBN:9781319013387Author:David S. Moore, George P. McCabe, Bruce A. CraigPublisher:W. H. Freeman
MATLAB: An Introduction with Applications
Statistics
ISBN:9781119256830
Author:Amos Gilat
Publisher:John Wiley & Sons Inc
Probability and Statistics for Engineering and th...
Statistics
ISBN:9781305251809
Author:Jay L. Devore
Publisher:Cengage Learning
Statistics for The Behavioral Sciences (MindTap C...
Statistics
ISBN:9781305504912
Author:Frederick J Gravetter, Larry B. Wallnau
Publisher:Cengage Learning
Elementary Statistics: Picturing the World (7th E...
Statistics
ISBN:9780134683416
Author:Ron Larson, Betsy Farber
Publisher:PEARSON
The Basic Practice of Statistics
Statistics
ISBN:9781319042578
Author:David S. Moore, William I. Notz, Michael A. Fligner
Publisher:W. H. Freeman
Introduction to the Practice of Statistics
Statistics
ISBN:9781319013387
Author:David S. Moore, George P. McCabe, Bruce A. Craig
Publisher:W. H. Freeman