MATLAB: An Introduction with Applications
6th Edition
ISBN: 9781119256830
Author: Amos Gilat
Publisher: John Wiley & Sons Inc
expand_more
expand_more
format_list_bulleted
Question
thumb_up100%

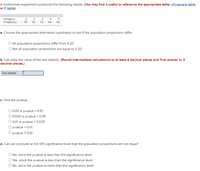
Transcribed Image Text:A multinomial experiment produced the following results: (You may find it useful to reference the appropriate table: chi-square table
or F table)
Category
Frequency
2
3
4
5
70
42
72
64
62
a. Choose the appropriate alternative hypothesis to test if the population proportions differ.
O All population proportions differ from 0.20.
O Not all population proportions are equal to 0.20.
b. Calculate the value of the test statistic. (Round intermediate calculations to at least 4 decimal places and final answer to 3
decimal places.)
Test statistic
c. Find the p-value.
O 0.05 s p-value < 0.10
O 0.025 s p-value < 0.05
O 0.01 s p-value < 0.025
O p-value < 0.01
O p-value 2 0.10
d. Can we conclude at the 10% significance level that the population proportions are not equal?
O No, since the p-value is less than the significance level.
Yes, since the p-value is less than the significance level.
O No, since the p-value is more than the significance level.
Expert Solution
This question has been solved!
Explore an expertly crafted, step-by-step solution for a thorough understanding of key concepts.
This is a popular solution
Trending nowThis is a popular solution!
Step by stepSolved in 2 steps

Knowledge Booster
Learn more about
Need a deep-dive on the concept behind this application? Look no further. Learn more about this topic, statistics and related others by exploring similar questions and additional content below.Similar questions
- Given the following boxplot, what is the second quartile value for these data? Round to one decimal place. 2.2 3.1 V 3.6 4.8 7.1arrow_forward12arrow_forwardI need help with stats, section 7.2 and 7.3, please help with TI-84 calculator commands Test the claim about the population mean, μ, at the given level of significance using the given sample statistics. Claim: μ=40; α=0.01; σ=3.17. Sample statistics: x=38.1, n=72 Identify the null and alternative hypotheses. Write out the correct null and alternative hypotheses. Calculate the standardized test statistic: The standardized test statistic is ________________ (round to 2 decimal places as needed) Determin the critical value(s). Select the correct choice below and fill in the answer box to complete your choice. (round to 2 decimal places as needed) a. the critical value is ______________ b. the critical values are + _ ___________ Determine the outcome and conclusion of the test. Choose the correct answer below. A. fail to reject Ho. AT the 1% significane level, there is not enough evidence to reject the claim. B. fail to reject Ho. At the 1% significance…arrow_forward
- One of the following is an example of a question that might be asked to ascertain a problem with a nonrepresentative sample. Which one? O Do the signs of the residuals alternate? O Does the population have an omitted variable? O Do the residuals show nonconstant variance? O Does the sample contain about the same geographic coverage as the population?arrow_forward9.13 Given a sample size of 36, how large does the population standard deviation have to be in order for the standard error to be A. 1? B. 2? C. 5? D. 100?arrow_forwardch.8 proportions question4 Assume that a sample is used to estimate a population proportion p. Find the 99% confidence interval for a sample of size 143 with 65% successes. Enter your answer as an open-interval (i.e., parentheses) using decimals (not percents) accurate to three decimal places.C.I. =arrow_forward
- of 23 Step 1 of 1 Question 10 Four scenarios of statistical studies are given below. Decide which study uses a sample statistic. 01:26:15 An estimated 15% of Americans don't use the internet. Keypad Keyboard Shortcuts The average finish time for the Ironman, Kona was 11:32 for the 1883 finishers, with an average swim time of 1:14, an average bike time of 5:53, and an average run time of 4:14. A study prompted by the increase in the use of assisted reproductive technology looked O at hospital records across the country. The report stated that an estimated 3.2 % of births in the U.S. last year resulted in twins. In a study of 89 of the children diagnosed with cancer at Leeland Memorial Hospital, 70 children were cancer-free five years after their first diagnosis.arrow_forwardQuestion 6.130 What is the p-value? Would you accept or reject the null at the 12% level?arrow_forward
arrow_back_ios
arrow_forward_ios
Recommended textbooks for you
 MATLAB: An Introduction with ApplicationsStatisticsISBN:9781119256830Author:Amos GilatPublisher:John Wiley & Sons Inc
 Probability and Statistics for Engineering and th...StatisticsISBN:9781305251809Author:Jay L. DevorePublisher:Cengage Learning
 Statistics for The Behavioral Sciences (MindTap C...StatisticsISBN:9781305504912Author:Frederick J Gravetter, Larry B. WallnauPublisher:Cengage Learning
 Elementary Statistics: Picturing the World (7th E...StatisticsISBN:9780134683416Author:Ron Larson, Betsy FarberPublisher:PEARSON
 The Basic Practice of StatisticsStatisticsISBN:9781319042578Author:David S. Moore, William I. Notz, Michael A. FlignerPublisher:W. H. Freeman
 Introduction to the Practice of StatisticsStatisticsISBN:9781319013387Author:David S. Moore, George P. McCabe, Bruce A. CraigPublisher:W. H. Freeman

MATLAB: An Introduction with Applications
Statistics
ISBN:9781119256830
Author:Amos Gilat
Publisher:John Wiley & Sons Inc

Probability and Statistics for Engineering and th...
Statistics
ISBN:9781305251809
Author:Jay L. Devore
Publisher:Cengage Learning

Statistics for The Behavioral Sciences (MindTap C...
Statistics
ISBN:9781305504912
Author:Frederick J Gravetter, Larry B. Wallnau
Publisher:Cengage Learning

Elementary Statistics: Picturing the World (7th E...
Statistics
ISBN:9780134683416
Author:Ron Larson, Betsy Farber
Publisher:PEARSON

The Basic Practice of Statistics
Statistics
ISBN:9781319042578
Author:David S. Moore, William I. Notz, Michael A. Fligner
Publisher:W. H. Freeman

Introduction to the Practice of Statistics
Statistics
ISBN:9781319013387
Author:David S. Moore, George P. McCabe, Bruce A. Craig
Publisher:W. H. Freeman