Human Anatomy & Physiology (11th Edition)
11th Edition
ISBN: 9780134580999
Author: Elaine N. Marieb, Katja N. Hoehn
Publisher: PEARSON
expand_more
expand_more
format_list_bulleted
Question

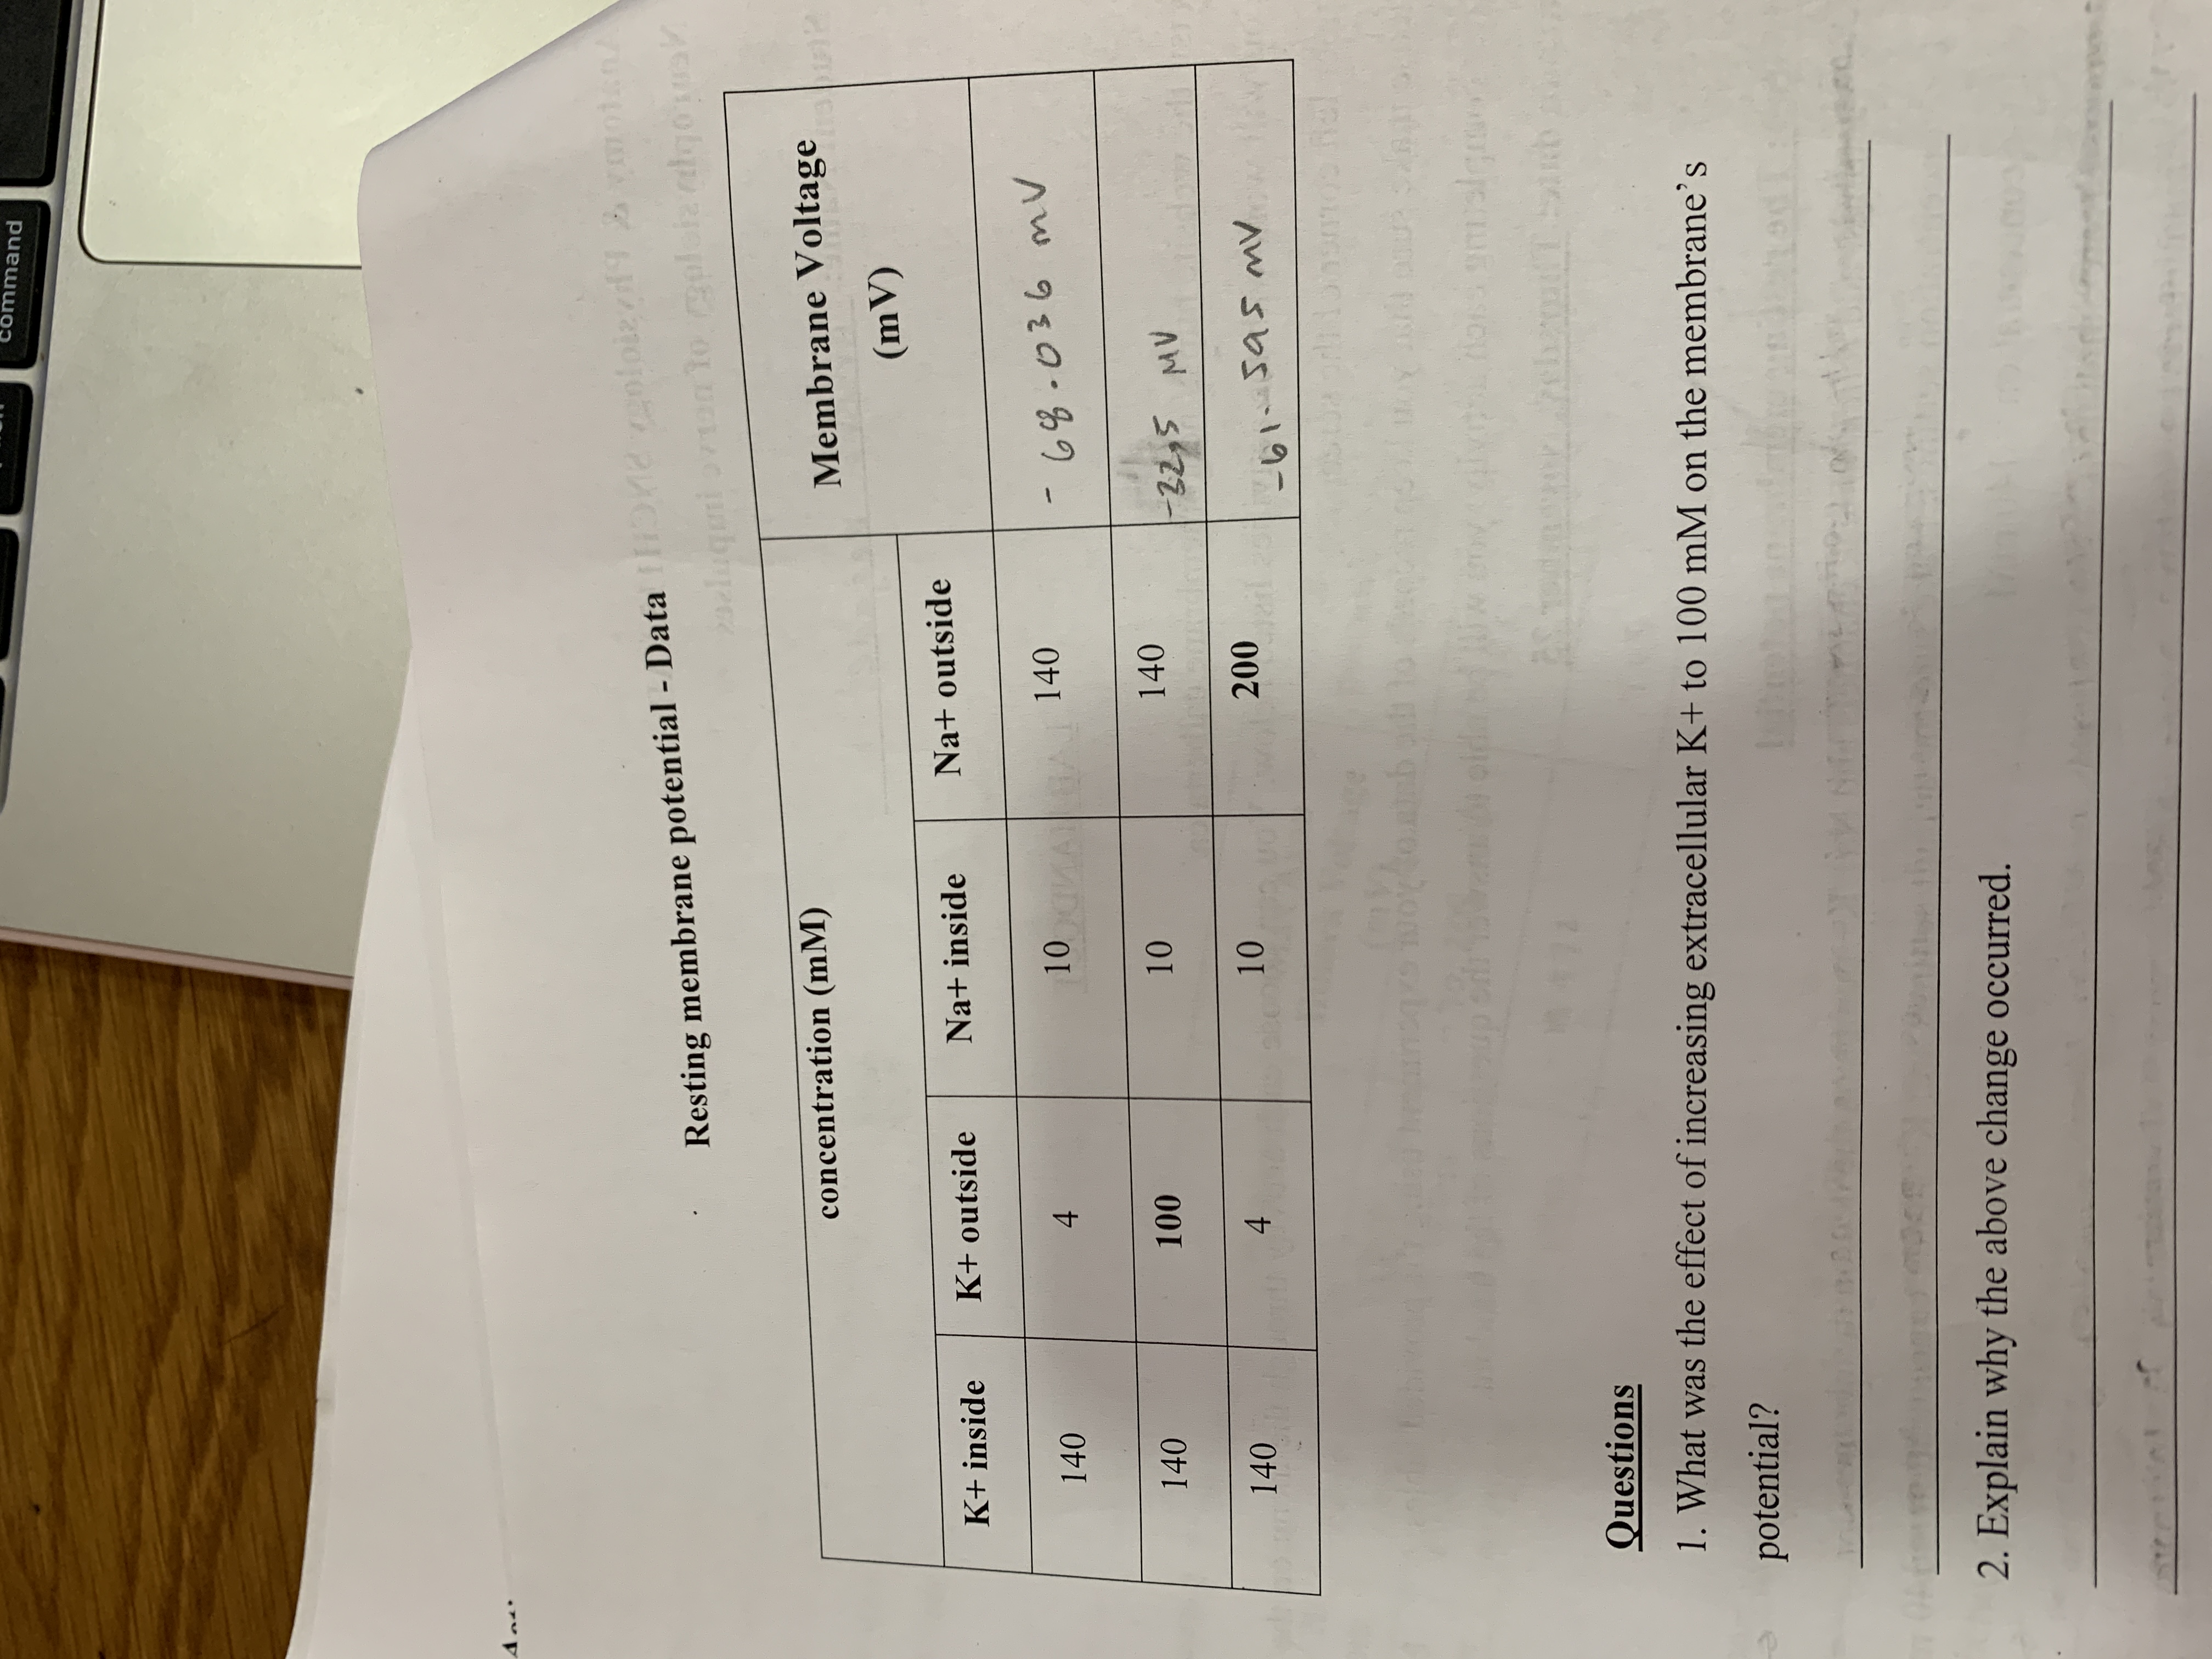
Transcribed Image Text:**Resting Membrane Potential - Data**
| Concentration (mM) | K⁺ Inside | K⁺ Outside | Na⁺ Inside | Na⁺ Outside | Membrane Voltage (mV) |
|---------------------|-----------|------------|------------|-------------|-----------------------|
| | 140 | 4 | 10 | 140 | -68.036 |
| | 140 | 100 | 10 | 140 | -22.5 |
| | 140 | 4 | 10 | 200 | -61.545 |
**Questions**
1. What was the effect of increasing extracellular K⁺ to 100 mM on the membrane's potential?
2. Explain why the above change occurred.
**Explanation of Data**
This table represents the changes in membrane voltage (mV) with different ionic concentrations (in mM) inside and outside the cell. The first row is the baseline scenario, with typical K⁺ and Na⁺ distribution, showing a membrane voltage of -68.036 mV. The second row indicates an increase in extracellular K⁺ concentration to 100 mM, resulting in a membrane voltage shift to -22.5 mV. The third row examines an increase in extracellular Na⁺ to 200 mM, with the voltage changing to -61.545 mV.
Readers are encouraged to consider how these changes affect the resting membrane potential, reflecting on the Nernst equation and the principles of ionic equilibrium across a cell membrane.
Expert Solution
This question has been solved!
Explore an expertly crafted, step-by-step solution for a thorough understanding of key concepts.
Step by stepSolved in 2 steps

Knowledge Booster
Similar questions
- (Short Answer - 8 Sentences Max) The sodium-potassium pump maintains the electrochemical gradient across the membrane. Describe and explain how this process occurs.arrow_forwardQ4.6. If calcium ions, each of which has a charge of +2 (Ca2*), moved OUT OF a neuron, and no other ions were moving, what would be TRUE? The area outside the neuron would be become more negatively charged. The concentration of Ca2* inside the cell would increase. The neuron would become more negative. The neuron would become more positive.arrow_forwardQ5.6. If calcium ions, each of which has a charge of +2 (Ca²+), moved INTO a neuron, and no other ions were moving, what would be TRUE? The area outside the neuron would be become more positively charged. The concentration of Ca²+ inside the cell would decrease. The neuron would become more negative. The neuron would become more positive. Submitarrow_forward
- Q5.8. In a neuron with a Vm of 0, there is a high concentration of K* inside of the cell and a low concentration outside. Which statement below is TRUE? If K+ channels were open and the electrical forces were absent, diffusion would result in a net movement of K* out of the cell. If K+ channels were closed, Na* would flow into the neuron. If K+ channels were open and the effect of diffusion was absent, the electrical forces would move K+ out of the cell. The membrane potential would be at the K* equilibrium potential, because concentrations of K* are not balanced. Submitarrow_forwardQuestion 3 of 18 28. Concerning concentration differences across the plasma membrane, there are Select the correct response: more K+ and Na+ ions inside the cell than outside. more K+ inside the cell than outside and more Na+ ions outside the cell than inside. more K+ and Na+ ions outside the cell than inside. more K+ outside the cell than inside and more Na+ ions inside the cell than outside.arrow_forward22- For EPSP, which is the most important ion flow: A. Sodium ions diffuse out of the cell. C. Sodium ions diffuse into the cell. B. Potassium ions diffuse out of the cell. D. Potassium ions diffuse into the cell.arrow_forward
arrow_back_ios
arrow_forward_ios
Recommended textbooks for you
 Human Anatomy & Physiology (11th Edition)Anatomy and PhysiologyISBN:9780134580999Author:Elaine N. Marieb, Katja N. HoehnPublisher:PEARSON
 Anatomy & PhysiologyAnatomy and PhysiologyISBN:9781259398629Author:McKinley, Michael P., O'loughlin, Valerie Dean, Bidle, Theresa StouterPublisher:Mcgraw Hill Education,
 Human AnatomyAnatomy and PhysiologyISBN:9780135168059Author:Marieb, Elaine Nicpon, Brady, Patricia, Mallatt, JonPublisher:Pearson Education, Inc.,
 Anatomy & Physiology: An Integrative ApproachAnatomy and PhysiologyISBN:9780078024283Author:Michael McKinley Dr., Valerie O'Loughlin, Theresa BidlePublisher:McGraw-Hill Education
 Human Anatomy & Physiology (Marieb, Human Anatomy...Anatomy and PhysiologyISBN:9780321927040Author:Elaine N. Marieb, Katja HoehnPublisher:PEARSON

Human Anatomy & Physiology (11th Edition)
Anatomy and Physiology
ISBN:9780134580999
Author:Elaine N. Marieb, Katja N. Hoehn
Publisher:PEARSON

Anatomy & Physiology
Anatomy and Physiology
ISBN:9781259398629
Author:McKinley, Michael P., O'loughlin, Valerie Dean, Bidle, Theresa Stouter
Publisher:Mcgraw Hill Education,

Human Anatomy
Anatomy and Physiology
ISBN:9780135168059
Author:Marieb, Elaine Nicpon, Brady, Patricia, Mallatt, Jon
Publisher:Pearson Education, Inc.,

Anatomy & Physiology: An Integrative Approach
Anatomy and Physiology
ISBN:9780078024283
Author:Michael McKinley Dr., Valerie O'Loughlin, Theresa Bidle
Publisher:McGraw-Hill Education

Human Anatomy & Physiology (Marieb, Human Anatomy...
Anatomy and Physiology
ISBN:9780321927040
Author:Elaine N. Marieb, Katja Hoehn
Publisher:PEARSON