
MATLAB: An Introduction with Applications
6th Edition
ISBN: 9781119256830
Author: Amos Gilat
Publisher: John Wiley & Sons Inc
expand_more
expand_more
format_list_bulleted
Related questions
Question
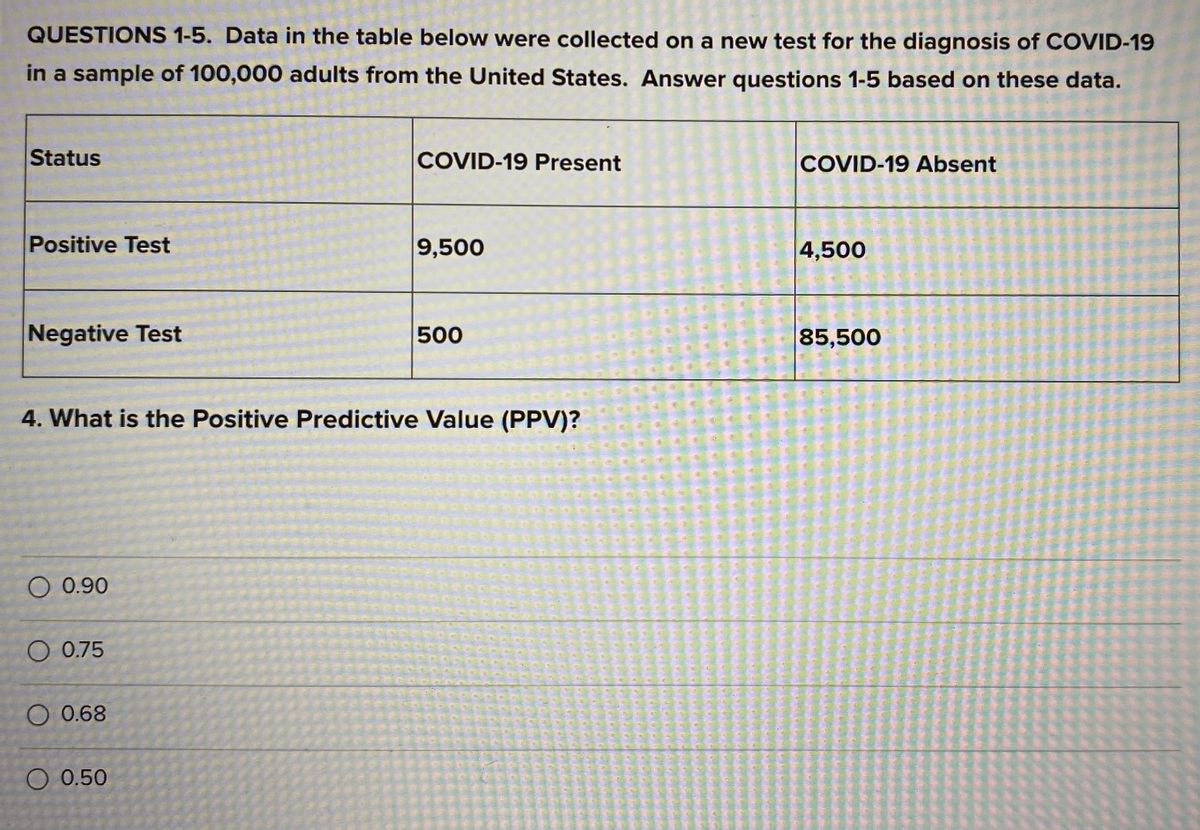

Transcribed Image Text:QUESTIONS 1-5. Data in the table below were collected on a new test for the diagnosis of COVID-19
in a sample of 100,000 adults from the United States. Answer questions 1-5 based on these data.
Status
COVID-19 Present
COVID-19 Absent
Positive Test
9,500
4,500
Negative Test
500
85,500
4. What is the Positive Predictive Value (PPV)?
O 0.90
O 0.75
O 0.68
O 0.50
Expert Solution
This question has been solved!
Explore an expertly crafted, step-by-step solution for a thorough understanding of key concepts.

This is a popular solution

Trending nowThis is a popular solution!

Step by stepSolved in 2 steps

Knowledge Booster

Similar questions
- The data is presented in parallel format. Before running the ANOVA in Excel, you will need to put it into serial (column) format. You will need to create a categorical variable for the first factor (days) and for the second factor (time of day). This is a critical step.The data presented shows exam scores for students randomly assigned to the sections meeting on these days at these times of the day: Thursday Friday Morning Afternoon Morning Afternoon 70.878.15978.246.646.476.559.376.370 65.678.359.359.778.680.892.780.865.392.3 90.890.569.177.36977.558.677.877.558.6 63.372.854.254.472.166.26372.56672.2 Conduct a 2-way ANOVA. First, find the group means for each level of the factors. (Report answers accurate to 2 decimal places.)Days: MThursday=MThursday= MFriday=MFriday= Time of day: Mmorning=Mmorning= Mafternoon=Mafternoon= Report the results of the ANOVA for the main & interaction effects. (Report P-values accurate to 4 decimal places and…arrow_forwardSrddharrow_forwardA local veterinarian uses Z-scores to determine if newborn puppies of certain breeds are severely underweight, underweight, overweight, severely overweight, or within a typical weight range for their breed. Z-score Diagnosis Severely underweight Between -4.0 and -3.0 Underweight Less than -4.0 Between -3.0 and 3.0 Within the normal range Between 3.0 and 4.0 Overweight Severely overweight Greater than 4.0 Breed Mean (pounds) Standard deviation (pounds) Siberian Husky 23.2 2.5 Golden Retriever 31.5 2.1 Chow Chow 18.5 2.4 Shiba Inu 13.9 1.2 (a) What values would be considered to be normal for a hypothetical Siberian Husky puppy? Between and Enter an integer or decimal number (more. Report these answers to one decimal place (nearest tenth). (b) Show calculations and explain your reasoning.arrow_forward
- A new screening test for Lyme disease is developed for use in the general population. The sensitivity and specificity of the new test are 60% and 70%, respectively. Five hundred people are screened at a clinic during the first year the new test is implemented. Assume the true prevalence of Lyme disease among clinic attendees is 10%. Calculate the predictive value of a positive test.arrow_forwardThe authors of a paper classified characters who were depicted smoking in movies released between a certain range of years. The smoking characters were classified according to sex and whether the character type was positive, negative, or neutral. The resulting data are summarized in the accompanying table. Assume that it is reasonable to consider this sample of smoking movie characters as representative of smoking movie characters. Do the data provide evidence an association between sex and character type for movie characters who smoke? Use α = 0.05. Sex = Male Female Positive Negative Neutral 256 Character Type 85 107 11 132 51 Calculate the test statistic. (Round your answer to two decimal places.) x² Use technology to calculate the P-value. (Round your answer to four decimal places.) P-value = What can you conclude? O Reject Ho. There is convincing evidence to conclude that there is an association between sex and character type for movie characters who smoke. Fail to reject Ho.…arrow_forwardInvestigation 3.2: Valence Differences Between R&B and Rap Genres (Paired)A music fan claims that R&B songs tend to have a more positive tone on average than do Rapsongs. The individual collected two independent random samples from the population of SpotifySongs. Fifteen R&B songs and another fifteen Rap songs were collected and their Valence wasrecorded. The music fan believed that pairing the song by their Danceability may provideadditional information. Danceability describes how suitable a track is for dancing based on acombination of musical elements including tempo, rhythm stability, beat strength, and overallregularity. A value of 0.0 is least danceable and 1 is most danceable. Thus, the individual pairedthe R&B song with the lowest danceability with the Rap song with the lowest danceability,followed by the second and second, third and third. She continued this process until the R&Bsong with the highest danceability was paired with the Rap song with the…arrow_forward
- Looking at the above summary statistics from July 2020 for patients with confirmed Covid-19 in adult critical care, answer the following questions: What is the sample size for patients with confirmed COVID 19 were in Adult Critical Care beds in the sample hospital (Hammersmith Hospital) What is the sample size for All critical care units for Patients with confirmed COVID19 Give a brief explanation of SD Give a brief explanation of IQR How old were the patients in General Adult Critical Care with confirmed COVID19 one SD below the mean at Hammersmith Hospital How old were the patients in General Adult Critical Care with confirmed COVID19 on the 25th centile at Hammersmith Hospital Calculate .arrow_forwardHutchinson-Gilford progeria syndrome is a rare genetic condition that produces rapid aging in children. In individuals with this syndrome, cardiovascular disease is a common cause of death in the teenage years. A clinical study examined the effect of treatment with the drug lonafarnib on a number of physiological outcomes. The researchers measured the pulse wave velocity (PWV) of 18 children diagnosed with progeria and recruited worldwide. The study reports that the mean PWV of 18 children diagnosed with progeria is 12.44 m/s, and the standard deviation is 3.638 m/s. Assuming that PWV is normally distributed, is there significant evidence that the mean PWV of children with progeria is abnormally high (i.e. greater than 6.6 m/s)? Let � (pronounced as "mu") be the true mean PWV of children with progeria. What are the two competing hypotheses? ["", "", "", ""] What is the test statistic? ["", "", "", ""] What is the p value? ["", "", "", ""] What is the rejection…arrow_forwardDr. Maddan's eye drops are supposed to cause significant reduction is eye redness. The following table shows the results of a recent study where a random sample of individuals took part in a placebo controlled study. No Reduction in Redness Reduction in Redness Total Eye Drops 120 220 340 No Eye Drops Total 120 140 260 240 360 600 With 5% level of significance, determine if eye redness reduction is dependent upon taking the eye drops. Provide, a. the Chi-square statistic. b. the critical value or the p-value. c. Your decision on whether or not to reject Ho.arrow_forward
- Question 2 A researcher was interested in studying if there is a significant relationship between the severity of COVID 19 and blood types of individuals. 2400 individuals were studied and the results are shown below. Condition Blood Type Blood Type Blood Type Blood Type Blood Type O A B AB Total Critical 64.00 44 20 8 136 Severe 175.00 129 50 15 369 Moderate 211.00 528 151 125 1015 Mild 200.00 400 140 140 880 Total 650.00 1101 361 288 2400 State both the null and alternative hypotheses. Provide the decision rule for making this decision. Use an alpha level of 5%.arrow_forwardA team of epidemiologists at the Mayo Clinic wanted to find whether there is an association between obesity and cardiovascular disease (CVD). They conducted a prospective cohort study following obese and non-obese individuals who were free of CVD at the beginning of study for five years. The investigators were also interested in assessing age as a potential confounder, effect modifier, or both. Use the data below to answer the accompanying questions. CVD No CVD Total Obese 10 90 100 Not Obese 35 465 500 Total 45 555 600 CVD No CVD Total Obese 36 164 200 Not Obese 25 175 200 Total 61 339 400 1. Compute the appropriate measure of association for those who were less than age 50. 2. Compute the appropriate measure of association for those who were older or equal to age 50. 3. Compute the crude measure of association? 4. List three attributes that age must satisfy before it could…arrow_forward
arrow_back_ios
arrow_forward_ios
Recommended textbooks for you
- MATLAB: An Introduction with ApplicationsStatisticsISBN:9781119256830Author:Amos GilatPublisher:John Wiley & Sons Inc
 Probability and Statistics for Engineering and th...StatisticsISBN:9781305251809Author:Jay L. DevorePublisher:Cengage Learning
 Statistics for The Behavioral Sciences (MindTap C...StatisticsISBN:9781305504912Author:Frederick J Gravetter, Larry B. WallnauPublisher:Cengage Learning
  Elementary Statistics: Picturing the World (7th E...StatisticsISBN:9780134683416Author:Ron Larson, Betsy FarberPublisher:PEARSON
 The Basic Practice of StatisticsStatisticsISBN:9781319042578Author:David S. Moore, William I. Notz, Michael A. FlignerPublisher:W. H. Freeman
 Introduction to the Practice of StatisticsStatisticsISBN:9781319013387Author:David S. Moore, George P. McCabe, Bruce A. CraigPublisher:W. H. Freeman
MATLAB: An Introduction with Applications
Statistics
ISBN:9781119256830
Author:Amos Gilat
Publisher:John Wiley & Sons Inc
Probability and Statistics for Engineering and th...
Statistics
ISBN:9781305251809
Author:Jay L. Devore
Publisher:Cengage Learning
Statistics for The Behavioral Sciences (MindTap C...
Statistics
ISBN:9781305504912
Author:Frederick J Gravetter, Larry B. Wallnau
Publisher:Cengage Learning
Elementary Statistics: Picturing the World (7th E...
Statistics
ISBN:9780134683416
Author:Ron Larson, Betsy Farber
Publisher:PEARSON
The Basic Practice of Statistics
Statistics
ISBN:9781319042578
Author:David S. Moore, William I. Notz, Michael A. Fligner
Publisher:W. H. Freeman
Introduction to the Practice of Statistics
Statistics
ISBN:9781319013387
Author:David S. Moore, George P. McCabe, Bruce A. Craig
Publisher:W. H. Freeman