
MATLAB: An Introduction with Applications
6th Edition
ISBN: 9781119256830
Author: Amos Gilat
Publisher: John Wiley & Sons Inc
expand_more
expand_more
format_list_bulleted
Related questions
Question
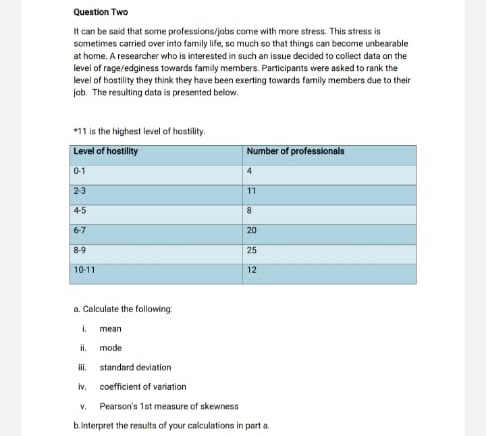

Transcribed Image Text:Question Two
It can be said that some professions/jobs come with more stress. This stress is
sometimes carried over into family life, so much so that things can become unbearable
at home. A researcher who is interested in such an issue decided to collect data on the
level of rage/edginess towards family members. Perticipants were asked to rank the
level of hostility they think they have been exerting towards family members due to their
job. The resulting data is presented below.
*11 is the highest level of hostility.
Level of hostility
Number of professionala
0-1
23
11
4-5
6-7
20
8-9
25
10-11
12
a. Calculate the following:
i.
mean
il.
mode
i,
standard deviation
iv,
coefficient of variation
V.
Pearson's 1st measure of skewness
b.interpret the results of your calculations in part a.
Expert Solution
arrow_forward
Step 1
Since you have posted a question with multiple sub-parts, we will solve first three sub-
parts for you. To get remaining sub-part solved please repost the complete question and mention the sub-parts to be solved.
(i) To find the mean:
| Level of hostility | Number of professionals, f | Mid value, x | fx |
| 0 to 1 | 4 | 0.5 | 2 |
| 2 to 3 | 11 | 2.5 | 27.5 |
| 4 to 5 | 8 | 4.5 | 36 |
| 6 to 7 | 20 | 6.5 | 130 |
| 8 to 9 | 25 | 8.5 | 212.5 |
| 10 to 11 | 12 | 10.5 | 126 |
| Total | 80 | 534 |

Step by stepSolved in 3 steps

Knowledge Booster


Learn more about
Need a deep-dive on the concept behind this application? Look no further. Learn more about this topic, statistics and related others by exploring similar questions and additional content below.Similar questions
- Please see below. I am only given one opportunity at this. Please help!! Successful hotel managers must have personality characteristics often thought of as feminine (such as "compassionate") as well as those often thought of as masculine (such as "forceful"). The Bem Sex-Role Inventory (BSRI) is a personality test that gives separate ratings for female and male stereotypes, both on a scale of 1 to 7. A sample of 148 male general mangers of three-star and four-star hotels had mean BSRI femininity score of 5.29 with a SD of 0.78. The mean score for the general male population is μ=5.19. Do hotel managers on the average differ significantly in femininity score from men in general? A 2-sample test for proportions B z-test for proportions C 2-sample test for means D t-test for means E z-test for meansarrow_forwardThe following two-by-two table was created from the data. WAKE UP DURING THE NIGHT GENDER Yes No TOTAL Female 125 25 150 Male 91 30 121 TOTAL 216 55 271 What is the risk (probability) of waking up during the night if you are a female? What is the risk (probability) of waking up during the night if you are a male? What is the relative risk (risk ratio) of waking up during the night if you are a female as compared to a male? State your finding in plain language:arrow_forwardA marketing agency wanted to determine if a new commercial changed people's opinion about a company. They recruited n=30 participants to watch the commercial. First, everyone was givien a survey to determine their attitudes toward the company. Then, everyone watched the new commercial. Finally, they were given the same survey again and asked about their attitudes toward the comapny after seeing the commercial. The agency wanted to see if attitudes were changed by the commercial. What statistical test should they use?arrow_forward
- The Energy Star rating system is an energy efficiency program run by the U.S. Environmental Protection Agency (EPA)Energy Star certified appliances, such as televisions and refrigerators, are rated in regard to their average energy consumption per year. A certain brand of Energy Star certified refrigerator is stated to have a mean yearly electricity cost of $99. A consumer advocacy organization believes that this claim is wrong, that the energy consumption of this particular refrigerator is different than $99 per year. The group collected a random sample of 16 refrigerators of the model in question and had each lab-tested for electricity consumption. The yearly energy consumption of each is given below. 96.7697.898.67 95.52 97.8 95.896.9299.57 97.64 95.46 98.03 96.42 99.32 98.99 95.2197.12 Using alpha = 0.1 , test the hypothesis that the average yearly electricity consumption of the refrigerator in question is different than $99 per year. Assume that the distribution of all electricity…arrow_forwardIf correlation does not imply causation, what does it imply?arrow_forwardA clinical psychologist is investigating the relationship between sleep and feelings ofanxiety. For a sample of 15 individuals, he asks each participant to indicate how many hours theytypically sleep each night and each participant also completes an anxiety assessment. The followingdata is obtained:Hours of sleep: M=6.0 SS=16.0Anxiety scores: M=8.0 SS=64.0SP = - 20.0 a. Compute the correlation between hours of sleep and anxiety scores.arrow_forward
- A graduate student is interested in how viewing different types of scenes affects working memory. For his study, he selects a random sample of 36 adults. The subjects complete a series of working memory tests before and after walking in an urban setting. Before the walk, the mean score on the test of working memory was 9.1. After the walk, the mean score was 1.4 higher. The graduate student has no presupposed assumptions about how viewing different types of scenes affects working memory, so he formulates the null and alternative hypotheses as: H00 : μDD = 0 H11 : μDD ≠ 0 Assume that the data satisfy all of the required assumptions for a repeated-measures t test. The graduate student calculates the following statistics for his hypothesis test: Mean difference (MDD) 1.4 Estimated population standard deviation of the differences (s) 1.6 Estimated standard error of the mean differences (sMDMD) 0.2667 Degrees of freedom (df) 35 The t statistic 5.25 The critical values of t…arrow_forwardA researcher gathered a sample of participants who volunteered for a studying of phobias. She measured anxiety level of participants as they viewed photos of spiders and again when they viewed puppies. Which statistical test is appropriate for this study and why?arrow_forwardThese two questions please.arrow_forward
- Page 160 #17 We predict that children exhibit more aggressive act after watching a violent television show. The scores for ten children were recorded before they watched a violent show and then after they watched a violent show. Aggression was measured in terms of number of aggressive acts (e.g. hitting, yelling, kicking etc). Sample 1 (after TV show): 5,6,4,4,7,3,2,1,4,1 Sample 2 (before TV show): 4,6,3,2,4,1,0,0,5,2 Is this a one-tailed or two-tailed test?arrow_forward1 a) Hair color is an True False example of a qualitative data.arrow_forwardIs there a relation between incidents of child abuse and number of runaway children? A random sample of cities (over 10,000 population) gave the following information about the number of reported incidents of child abuse and the number of runaway children. (Reference: Federal Bureau of Investigation, U.S. Department of Justice.) City 1 2 3 4 5 6 7 8 9 10 11 12 13 14 15 Abuse cases 113 33 41 60 52 99 31 56 15 67 106 59 45 74 84 Runaways 648 188 285 687 421 590 284 277 162 473 600 432 317 580 592 Use a 1% level of significance to test the claim that there is a monotone-increasing relationship between the ranks of incidents of abuse and number of runaway children. (a) Rank-order abuse using 1 as the largest data value. Also rank-order runaways using 1 as the largest data value. Then construct a table of ranks to be used for a Spearman rank correlation test. City Abuse CasesRank x RunawaysRank y d = x - y d2 123456789101112131415 Σd2 = (b) What is the level of…arrow_forward
arrow_back_ios
SEE MORE QUESTIONS
arrow_forward_ios
Recommended textbooks for you
- MATLAB: An Introduction with ApplicationsStatisticsISBN:9781119256830Author:Amos GilatPublisher:John Wiley & Sons Inc
 Probability and Statistics for Engineering and th...StatisticsISBN:9781305251809Author:Jay L. DevorePublisher:Cengage Learning
 Statistics for The Behavioral Sciences (MindTap C...StatisticsISBN:9781305504912Author:Frederick J Gravetter, Larry B. WallnauPublisher:Cengage Learning
  Elementary Statistics: Picturing the World (7th E...StatisticsISBN:9780134683416Author:Ron Larson, Betsy FarberPublisher:PEARSON
 The Basic Practice of StatisticsStatisticsISBN:9781319042578Author:David S. Moore, William I. Notz, Michael A. FlignerPublisher:W. H. Freeman
 Introduction to the Practice of StatisticsStatisticsISBN:9781319013387Author:David S. Moore, George P. McCabe, Bruce A. CraigPublisher:W. H. Freeman
MATLAB: An Introduction with Applications
Statistics
ISBN:9781119256830
Author:Amos Gilat
Publisher:John Wiley & Sons Inc
Probability and Statistics for Engineering and th...
Statistics
ISBN:9781305251809
Author:Jay L. Devore
Publisher:Cengage Learning
Statistics for The Behavioral Sciences (MindTap C...
Statistics
ISBN:9781305504912
Author:Frederick J Gravetter, Larry B. Wallnau
Publisher:Cengage Learning
Elementary Statistics: Picturing the World (7th E...
Statistics
ISBN:9780134683416
Author:Ron Larson, Betsy Farber
Publisher:PEARSON
The Basic Practice of Statistics
Statistics
ISBN:9781319042578
Author:David S. Moore, William I. Notz, Michael A. Fligner
Publisher:W. H. Freeman
Introduction to the Practice of Statistics
Statistics
ISBN:9781319013387
Author:David S. Moore, George P. McCabe, Bruce A. Craig
Publisher:W. H. Freeman