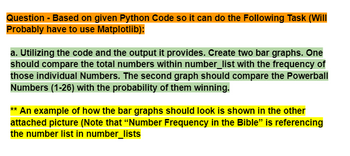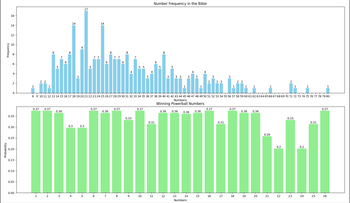
Edit the given Python Code (about Probability) so it can also output a Bar Graph. Please see the attached pics to complete it.
Code that Needs to be Edited:
from collections import Counter
from scipy.stats import binom
# Part A: Find the 7 most common repetitive numbers
number_list = [25, 23, 17, 25, 48, 34, 29, 34, 38, 42, 30, 50, 58, 36, 39, 28, 27, 35, 30, 34, 46, 46, 39, 51, 46, 75,
66, 20, 45, 28, 35, 41, 43, 56, 37, 38, 50, 52, 33, 44, 37, 72, 47, 20, 80, 52, 38, 44, 39, 49, 50, 56,
62, 42, 54, 59, 35, 35, 32, 31, 37, 43, 48, 47, 38, 71, 56, 53, 51, 25, 36, 54, 47, 71, 53, 59, 41, 42,
57, 50, 38, 31, 27, 33, 26, 40, 42, 31, 25, 26, 47, 26, 37, 42, 15, 60, 40, 43, 48, 30, 25, 52, 28, 41,
40, 34, 28, 40, 38, 40, 30, 35, 27, 27, 32, 44, 31, 32, 29, 31, 25, 21, 23, 25, 39, 33, 21, 36, 21, 14,
23, 33, 27, 31, 16, 23, 21, 13, 20, 40, 13, 27, 33, 34, 31, 13, 40, 58, 24, 24, 17, 18, 18, 21, 18, 16,
24, 15, 18, 33, 21, 13, 24, 21, 29, 31, 26, 18, 23, 22, 21, 32, 33, 24, 30, 30, 21, 23, 29, 23, 25, 18,
10, 20, 13, 18, 28, 12, 17, 18, 20, 15, 16, 16, 25, 21, 18, 26, 17, 22, 16, 15, 15, 25, 14, 18, 19, 16,
14, 20, 28, 13, 28, 39, 40, 29, 25, 27, 26, 18, 17, 20, 25, 25, 22, 19, 14, 21, 22, 18, 10, 29, 24, 21,
21, 13, 15, 25, 20, 29, 22, 11, 14, 17, 17, 13, 21, 11, 19, 17, 18, 20, 8, 21, 18, 24, 21, 15, 27, 21]
number_count = Counter(number_list)
most_common = number_count.most_common(7)
print("Most Common Numbers in New Testament:")
for num, count in most_common:
print(f"Number {num} appears {count} times")
# Part B: Find the 7 most uncommon numbers
least_common = number_count.most_common()[:-8:-1]
print("\nLeast Common Numbers in New Testament:")
for num, count in least_common:
print(f"Number {num} appears {count} times")
# Part C: Use binomial distribution to find the probability of each of the 7 common repetitive numbers
print("\nProbabilities of 7 Most Common Numbers (Using Binomial Distribution):")
for num, count in most_common:
total_trials = len(number_list)
successes = count
probability = binom.pmf(successes, total_trials, successes/total_trials)
print(f"Probability of seeing {num} appear exactly {count} times: {probability:.4f}")
print("\nProbabilities of 7 Most Common Numbers from the New Testament Winning the Powerball:")
# The provided "how often" data from the table
how_often_data = {
1: 4, 2: 4, 3: 3, 4: 7, 5: 8, 6: 4, 7: 3, 8: 4, 9: 6, 10: 3,
11: 2, 12: 3, 13: 3, 14: 5, 15: 2, 16: 5, 17: 2, 18: 4, 19: 3,
20: 4, 21: 8, 22: 1, 23: 5, 24: 1, 25: 2, 26: 4
}
# The total count of all occurrences
total_count = sum(how_often_data.values())
# The specific numbers we need to find the probabilities for
requested_numbers = [17, 18, 20, 21, 25, 27, 31]
# Calculate the probabilities
probabilities = {number: how_often_data.get(number, 0) / total_count for number in requested_numbers}
def print_probability(number, probability):
if number in how_often_data:
print(f"Probability of Number {number} being a winning number for Powerball: {probability:.4f}")
else:
print(f"Probability of Number {number} being a winning number is 0 because it is not a Powerball number.")
for number in requested_numbers:
print_probability(number, probabilities[number])


Step by stepSolved in 2 steps

- you get setup to work with graphs.Create a Graph class to store nodes and edges or download a Graph librarysuch as JUNG. Use it to implement Breadth First Search and Depth First SearchFollow the video from class if you need a reference.arrow_forwardIn this assignment, you will compare the performance of ArrayList and LinkedList. More specifically, your program should measure the time to “get” and “insert” an element in an ArrayList and a LinkedList.You program should 1. Initializei. create an ArrayList of Integers and populate it with 100,000 random numbersii. create a LinkedList of Integers and populate it with 100,000 random numbers2. Measure and print the total time it takes to i. get 100,000 numbers at random positions from the ArrayList 3. Measure and print the total time it takes to i. get 100,000 numbers at random positions from the LinkedList 4. Measure and print the total time it takes to i. insert 100,000 numbers in the beginning of the ArrayList 5. Measure and print the total time it takes to i. insert 100,000 numbers in the beginning of the LinkedList 6. You must print the time in milliseconds (1 millisecond is 1/1000000 second).A sample run will be like this:Time for get in ArrayList(ms): 1Time for get in…arrow_forwardThe purpose of this project is to assess your ability to (JAVA): Implement a graph abstract data type. The getDistance method should print the distance of all connected nodes/ vertices. A graph is a set of vertices and a set of edges. Represent the vertices in your graph with an array of strings: Represent the edges in your graph as a two-dimensional array of integers. Use the distances shown in the graph pictured here.Add the following functions to your graph class: A getDistance function that takes two vertices and returns the length of the edge between them. If the vertices are not connected, the function should return the max value for an integer. A getNeighbors function that takes a single vertex and returns a list of all the vertices connected to that vertex. A print method that outputs an adjacency matrix for your graph. Write a test program for your Graph class.arrow_forward
- In python. A program that analyzes a set of numbers can be very useful. Create an Analysis application thatprompts the user for numbers in the range 1 through 50, terminated by a sentinel, and then performsthe following analysis on the numbers:• Determine the average number• Determine the maximum number• Determine the range (maximum – minimum)• Determine the median (the number that occurs the most often)• Displays a bar graph called a histogram that shows the numbers in each five-unitrange (1–5, 6–10, 11-15, etc.). The histogram may look similar to:arrow_forwardExecute the following statements over initially empty ArrayList myList one after another (cascade). Explain what was changed after each statement (what did it do?) myList.add("z"); ArrayList content: Your explanation (where this output came from): myList.add(0, "a"); ArrayList content: Your explanation (where this output came from): myList.add("t"); ArrayList content: Your explanation (where this output came from): myList.add(2,"w"); ArrayList content: Your explanation (where this output came from): myList.set(0,"b"); ArrayList content: Your explanation (where this output came from):arrow_forwardThis is in java.arrow_forward
- Write a for loop to print all elements in courseGrades, following each element with a space (including the last). Print forwards, then backwards. End each loop with a newline. Ex: If courseGrades = {7, 9, 11, 10}, print: 7 9 11 10 10 11 9 7 Hint: Use two for loops. Second loop starts with i = courseGrades.length - 1. import java.util.Scanner; public class CourseGradePrinter {public static void main (String [ ] args) {Scanner scnr = new Scanner(System.in);final int NUM_VALS = 4;int [ ] courseGrades = new int[NUM_VALS];int i; for (i = 0; i < courseGrades.length; ++i) {courseGrades[i] = scnr.nextInt();} /* Your solution goes here */ }}arrow_forwardusing c++ dynamic queue. i want the output to be like that image . you can refer phython at this link. https://runestone.academy/ns/books/published//pythonds/BasicDS/SimulationPrintingTasks.html the situation is . On any average day about 10 students are working in the lab at any given hour. These students uses theshared printer in the lab to print their assignments and reading materials. The timetaken for printing tasks varies from one another depending on the pages volumesprinted by students. Students can send printing instructions from any terminalsattached to same network of the printer. Hence, many students can do so at once take note that i want it in c++ dynamic queue.arrow_forwardI need help solving this in JAVAarrow_forward
- PLEASE MAKE IT RUN LIKE THE EXPECTED PICTUREarrow_forwardPlease answer the question in the screenshot. Please use the starter code.arrow_forwardWrite a java code to prepare a note for teaching your juniors on the topic of DFS in a Graph. (Main point: The output from your writen codes will be cosidered as the note the output should contain the notes about DFS in a graph with an example)arrow_forward
 Database System ConceptsComputer ScienceISBN:9780078022159Author:Abraham Silberschatz Professor, Henry F. Korth, S. SudarshanPublisher:McGraw-Hill Education
 Starting Out with Python (4th Edition)Computer ScienceISBN:9780134444321Author:Tony GaddisPublisher:PEARSON
 Digital Fundamentals (11th Edition)Computer ScienceISBN:9780132737968Author:Thomas L. FloydPublisher:PEARSON
 C How to Program (8th Edition)Computer ScienceISBN:9780133976892Author:Paul J. Deitel, Harvey DeitelPublisher:PEARSON
 Database Systems: Design, Implementation, & Manag...Computer ScienceISBN:9781337627900Author:Carlos Coronel, Steven MorrisPublisher:Cengage Learning
 Programmable Logic ControllersComputer ScienceISBN:9780073373843Author:Frank D. PetruzellaPublisher:McGraw-Hill Education


