
MATLAB: An Introduction with Applications
6th Edition
ISBN: 9781119256830
Author: Amos Gilat
Publisher: John Wiley & Sons Inc
expand_more
expand_more
format_list_bulleted
Related questions
Question

Transcribed Image Text:QUESTION 8
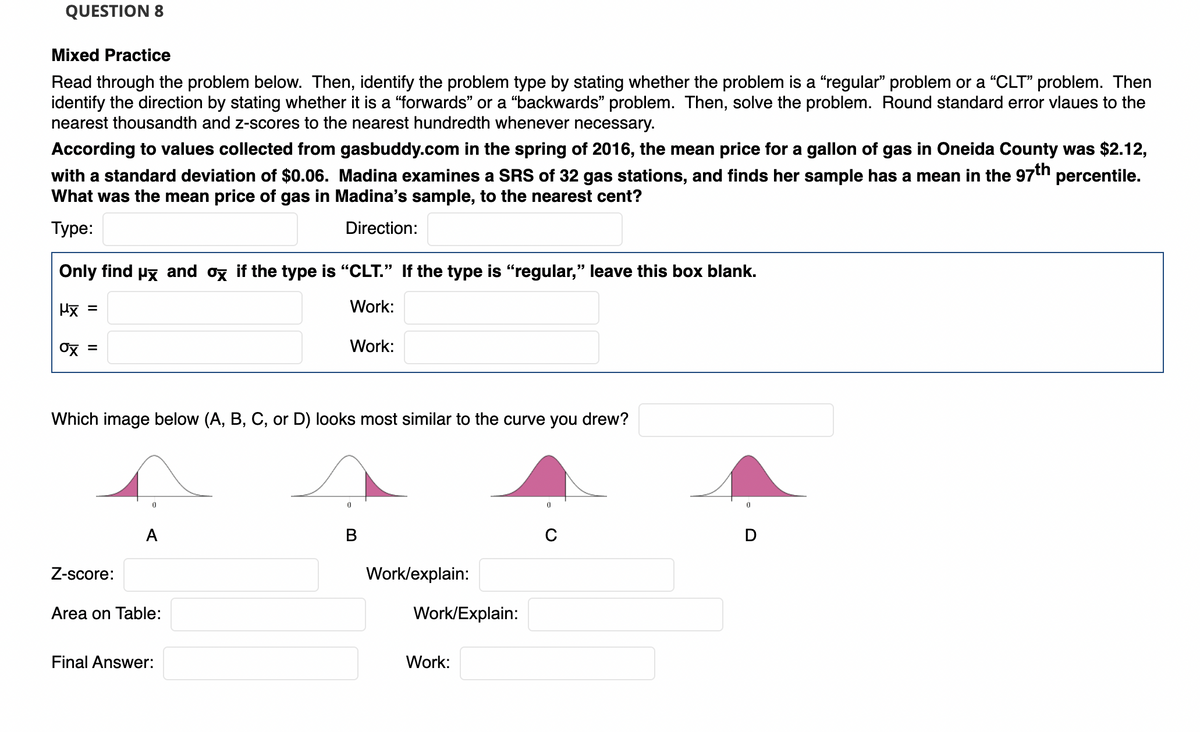
Mixed Practice
Read through the problem below. Then, identify the problem type by stating whether the problem is a "regular" problem or a "CLT" problem. Then
identify the direction by stating whether it is a “forwards" or a "backwards" problem. Then, solve the problem. Round standard error vlaues to the
nearest thousandth and z-scores to the nearest hundredth whenever necessary.
According to values collected from gasbuddy.com in the spring of 2016, the mean price for a gallon of gas in Oneida County was $2.12,
with a standard deviation of $0.06. Madina examines a SRS of 32 gas stations, and finds her sample has a mean in the 97th percentile.
What was the mean price of gas in Madina's sample, to the nearest cent?
Туре:
Direction:
Only find Px and ox if the type is "CLT." If the type is "regular," leave this box blank.
Mx =
Work:
Ox =
Work:
Which image below (A, B, C, or D) looks most similar to the curve you drew?
В
Z-score:
Work/explain:
Area on Table:
Work/Explain:
Final Answer:
Work:
Expert Solution
This question has been solved!
Explore an expertly crafted, step-by-step solution for a thorough understanding of key concepts.

Step by stepSolved in 3 steps with 1 images

Knowledge Booster

Similar questions
- The indicated IQ score, x, isarrow_forwardA recent study evaluated how addicted teenagers become to nicotine once they start smoking. The response variable was the number of yes answers on a questionnaire called the Hooked on Nicotine Checklist (HONC). Of teenagers who had tried tobacco, the mean HONC score was 4.2 (s = 5.4) for the 149 females and 2.8 (s=4.2) for the 190 males. Complete parts a through c below. 000 DOD F4 What does the standard error indicate? A. The standard error describes the spread of the sampling distribution of x₁ - x₂. B. The standard error is the standard deviation of the difference between x₁ - x₂. OC. The standard error is the standard deviation of the sample for this study. OD. The standard error is the difference in standard deviations for the two populations. ... b. Find the test statistic and P-value for Ho: H₁ H₂ and Ha: H₁ H₂. Interpret, and explain what (if any) effect gender has on the mean HONC score. Use the significance level 0.05. The test statistic is (Round to two decimal places as…arrow_forwardA city with 9800 registered voters has 5 candidates running for the city Mayor. Last week, 350 voters were randomly chosen and asked if they would vote for Peter Griffin (one of the candidates), and 22 % responded they would. On the election day, 35 % of the registered voters actually voted for Peter Griffin.Identify the parameter. 35 % 350 9800 5 22 % Unknownarrow_forward
arrow_back_ios
arrow_forward_ios
Recommended textbooks for you
- MATLAB: An Introduction with ApplicationsStatisticsISBN:9781119256830Author:Amos GilatPublisher:John Wiley & Sons Inc
 Probability and Statistics for Engineering and th...StatisticsISBN:9781305251809Author:Jay L. DevorePublisher:Cengage Learning
 Statistics for The Behavioral Sciences (MindTap C...StatisticsISBN:9781305504912Author:Frederick J Gravetter, Larry B. WallnauPublisher:Cengage Learning
  Elementary Statistics: Picturing the World (7th E...StatisticsISBN:9780134683416Author:Ron Larson, Betsy FarberPublisher:PEARSON
 The Basic Practice of StatisticsStatisticsISBN:9781319042578Author:David S. Moore, William I. Notz, Michael A. FlignerPublisher:W. H. Freeman
 Introduction to the Practice of StatisticsStatisticsISBN:9781319013387Author:David S. Moore, George P. McCabe, Bruce A. CraigPublisher:W. H. Freeman
MATLAB: An Introduction with Applications
Statistics
ISBN:9781119256830
Author:Amos Gilat
Publisher:John Wiley & Sons Inc
Probability and Statistics for Engineering and th...
Statistics
ISBN:9781305251809
Author:Jay L. Devore
Publisher:Cengage Learning
Statistics for The Behavioral Sciences (MindTap C...
Statistics
ISBN:9781305504912
Author:Frederick J Gravetter, Larry B. Wallnau
Publisher:Cengage Learning
Elementary Statistics: Picturing the World (7th E...
Statistics
ISBN:9780134683416
Author:Ron Larson, Betsy Farber
Publisher:PEARSON
The Basic Practice of Statistics
Statistics
ISBN:9781319042578
Author:David S. Moore, William I. Notz, Michael A. Fligner
Publisher:W. H. Freeman
Introduction to the Practice of Statistics
Statistics
ISBN:9781319013387
Author:David S. Moore, George P. McCabe, Bruce A. Craig
Publisher:W. H. Freeman