
A First Course in Probability (10th Edition)
10th Edition
ISBN: 9780134753119
Author: Sheldon Ross
Publisher: PEARSON
expand_more
expand_more
format_list_bulleted
Related questions
Concept explainers
Question
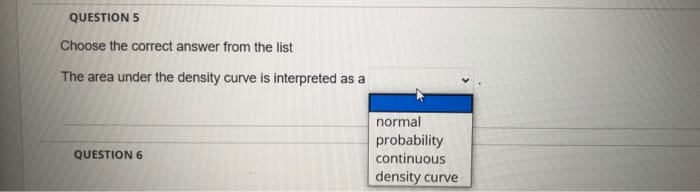

Transcribed Image Text:QUESTION 5
Choose the correct answer from the list
The area under the density curve is interpreted as a
normal
probability
continuous
QUESTION 6
density curve
Expert Solution
This question has been solved!
Explore an expertly crafted, step-by-step solution for a thorough understanding of key concepts.

Step by stepSolved in 2 steps with 2 images

Knowledge Booster


Learn more about
Need a deep-dive on the concept behind this application? Look no further. Learn more about this topic, probability and related others by exploring similar questions and additional content below.Similar questions
- Determine the area under the standard normal curve that lies to the right of Z=1.81 Z=0.56 Z=0.33 Z=0.96 This if for one question just has four parts to it. Let me know if not allowed.arrow_forwardBelow is a graph of a normal distribution with mean u = 3 and standard deviationo= 2. The shaded region represents the probability of obtaining a value from this distribution that is between 0 and 7. 0.4+ 0.3+ 0.2+ 0.1+ Shade the corresponding region under the standard normal density curve below. 04- 0.3+ 0.2+ 0.1+arrow_forwardBelow is a graph of a normal distribution with mean u = -2 and standard deviation o = 3. The shaded region represents the probability of obtaining a value from this distribution that is between -5 and -0.5. 0.4- 0.3- 0.2- .1- -5 - 0.5arrow_forward
- Find the speciffied areas for a normal density. (a) The area above 210 on a N(120, 42.3) distribution Round your answer to three decimal places. Area = i eTextbook and Media (b) The area below 49.4 on a N(50, 0.2) distribution Round your answer to three decimal places. Area = eTextbook and Media (c) The area between 0.7 and 1.4 on a N(1, 0.4) distribution Round your answer to three decimal places. Area = eTextbook and Mediaarrow_forward10arrow_forwardesc 37 hp Find The area under The Standard normal curve to the left of 2 = -2.45 то Curve Benween 2 = -1.42 and 2= 1.78 normy curve to the right of 2 = -2.43 © Find The normal curre that lies Between 2 = -0.75 and 2=1.7 1 Find the area undir The norimnai that lies outside the interval & 7 C 8 narrow_forward
- Below is a graph of a normal distribution with mean u=-5 and standard deviation o =4. The shaded region represents the probability of obtaining a value from this distribution that is greater than 1. 0.4 0.3- 0.2- 0.1- Shade the corresponding region under the standard normal density curve below.arrow_forwardi (Bo. v 12 v A A Aa v A 正处 AaßbCcDdEe AaBbCcDdEe AaBbCcD AaBbCcDdB IUvab x, x' A v 2v A No Spacing Normal Heading 1 Heading 2 In a standard normal distribution, how would you find the area to the right of any given value "x"? 19 words English (United States) E Focus stv Ps MacBook Air 888 F9 F10 F2 F3 F4 F5 F6 @ # 2$ 2 3 4 W E Y S D н K * 00arrow_forwardQuestion 8 a) P(Z = 0.77) = O 0.26 O 0.74 O 0.78 00 O 0.22 03.17 ▼ b) What is the area under the standard normal curve between z = -2.23 and 2 = 0.94? O 0.0129 O None of the above O 0.8135 O-1.29 O 0.8393 0.8264 Submit Question < Search b EB Warrow_forward
arrow_back_ios
arrow_forward_ios
Recommended textbooks for you
- A First Course in Probability (10th Edition)ProbabilityISBN:9780134753119Author:Sheldon RossPublisher:PEARSON

A First Course in Probability (10th Edition)
Probability
ISBN:9780134753119
Author:Sheldon Ross
Publisher:PEARSON