
MATLAB: An Introduction with Applications
6th Edition
ISBN: 9781119256830
Author: Amos Gilat
Publisher: John Wiley & Sons Inc
expand_more
expand_more
format_list_bulleted
Related questions
Concept explainers
Question
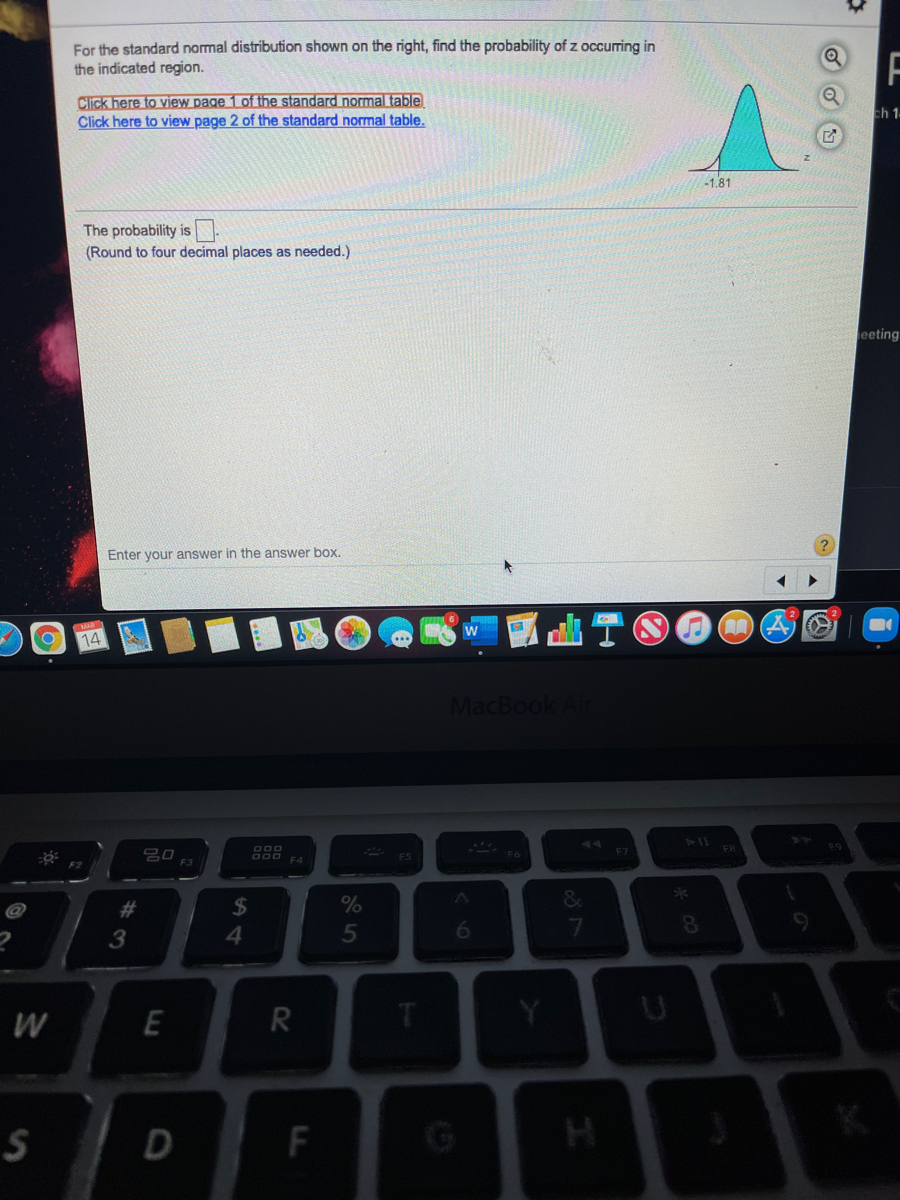

Transcribed Image Text:For the standard normal distribution shown on the right, find the probability of z occurring in
the indicated region.
Click here to view page 1 of the standard normal table
Click here to view page 2 of the standard normal table.
ch 1
The probability is
(Round to four decimal places as needed.)
eeting
Enter your answer in the answer box.
MAR
w
14
MacBook A
FB
吕口
F3
O00
F4
23
*
3
4
5
6.
E
R
T
S
G
H

Transcribed Image Text:Area under the standard normal distribution to the left of Z (page 1)
PM
-2.3
.0084
.0087
0089
.009
.0094
.0096
.0099
.0102
-2.2
0104
.0107
ch 14, 2
.0110
.0143
0113
0146
0188
.0116
0150
.0119
.0122
.0158
.0125
.0129
.0132
.0136
,0139
-2.1
.0154
.0162
.0166
.0170
0174
0179
-2.0
.0183
0233
.0192
.0197
0202
.0207
.0212
0217
.0222
.0228
-1.9
0239
.0244
0250
0256
.0262
0268
.0274
.0281
.0287
-1.8
0294
0301
0307
.0314
.0322
.0329
.0336
.0344
.0351
0359
1.7
0367
.0375
.0384
0392
.0401
.0409
0418
.0427
.0436
0446
-1.6
0455
.0465
.0475
0485
.0495
.0505
.0516
.0526
.0537
.0548
-1.5
0559
.0681
0571
.0582
.0708
.0594
0606
.0618
.0630
.0643
.0655
.0668
-1.4
-13
.0694
.0721
.0735
0749
.0764
.0778
0934
.0793
0951
.0808
0823
0838
.1003
.0853
.0869
0885
0968
.1151
0901
.0918
-1,2
0985
1020
.1038
1075
.1056
.1093
1112
31ו.
1170
1190
1251
1469
1,1
.1210
.1230
.1271
.1292
.1314
1335
.1357
1.0
.1379
1401
1423
.1446
.1492
1515
1539
.1562
eetings toc
.1587
0.9
1611
1635
1660
1685
1814
2090
1711
1736
1788
1841
2119
1762
1867
2148
0.8
1894
1922
.1949
1977
2005
2033
2061
-0.7
2177
2206
2236
2266
2296
2327
2358
2389
2420
0.6
2451
2514
2546
2483
2810
2546
2578
2611
2643
2676
2709
3050
3409
2743
-0.5
2776
3121
2877
2912
2946
3300
3085
.3446
2843
2981
3015
-0.4
3156
3520
.3192
3557
3228
3594
3264
3632
4013
3336
3707
.3372
-0.3
3483
3859
4247
366
3745
3783
3821
-0.2
3897
4286
4681
3936
4325
4721
3974
4052
4090
4129
.4168
4207
4602
5000
0.1
4443
4364
4761
4404
4483
4880
.4522
4562
-0.0
4641
4801
4840
4920
.4960
En
Print
Done
Ad
14
MacBook Air
吕口
F2
F4
2#
2$
%
&
3
4
5
7
8.
9
R
T
Y
F
DI
Expert Solution
This question has been solved!
Explore an expertly crafted, step-by-step solution for a thorough understanding of key concepts.

This is a popular solution

Trending nowThis is a popular solution!

Step by stepSolved in 2 steps with 2 images

Knowledge Booster


Learn more about
Need a deep-dive on the concept behind this application? Look no further. Learn more about this topic, statistics and related others by exploring similar questions and additional content below.Similar questions
- Find the area of the shaded region. The graph depicts the standard normal distribution with mean 0 and standard deviation 1. Click to view page 1 of the table. Click to view page 2 of the table. Z= 0.89 The area of the shaded region is (Round to four decimal places as needed.)arrow_forwardUse the standard normal distribution table to find the area. Right of z=0.84arrow_forwardFor the standard normal distribution shown on the right, find the probability of z occurring in the indicated region... Click here to view page 1 of the standard normal table. Click here to view page 2 of the standard normal table. ... The probability is. (Round to four decimal places as needed.) s -0.89arrow_forward
- Find the area of the shaded region. The graph depicts the standard normal distribution with mean 0 and standard deviation 1. Click to view page 1 of the table. Click to view page 2 of the table. The area of the shaded region is (Round to four decimal places as needed.) CECCO A 0.74arrow_forwardUse the standard normal table to find the z-score that corresponds to the given percentile. If the area is not in the table, use the entry closest to the area. If the area is halfway between two entries, use the z-score halfway between the corresponding z-scores. If convenient, use technology to find the z-score. P18 The z-score that corresponds to P18 isarrow_forwardplease answer the question in the photo, charts also attacthed in second photoarrow_forward
- For the standard normal distribution shown on the right, find the probability of z occurring in the indicated region. Click here to view page 1 of the standard normal table, Click here to view page 2 of the standard normal table. Question Viewer -1.07 The probability is. (Round to four decimal places as needed.) nts purarrow_forwardFor the standard normal distribution shown on the right, find the probability of z occurring in the indicated region. Click here to view page 1 of the standard normal table. Click here to view page 2 of the standard normal table. -2.13 The probability is (Round to four decimal places as needed.)arrow_forwardFind the margin of error for the given values of c, s, and n. c = 0.99, s = 3.1, n = 27 Click the icon to view the t-distribution table. The margin of error is (Round to one decimal place as needed.)arrow_forward
arrow_back_ios
arrow_forward_ios
Recommended textbooks for you
- MATLAB: An Introduction with ApplicationsStatisticsISBN:9781119256830Author:Amos GilatPublisher:John Wiley & Sons Inc
 Probability and Statistics for Engineering and th...StatisticsISBN:9781305251809Author:Jay L. DevorePublisher:Cengage Learning
 Statistics for The Behavioral Sciences (MindTap C...StatisticsISBN:9781305504912Author:Frederick J Gravetter, Larry B. WallnauPublisher:Cengage Learning
  Elementary Statistics: Picturing the World (7th E...StatisticsISBN:9780134683416Author:Ron Larson, Betsy FarberPublisher:PEARSON
 The Basic Practice of StatisticsStatisticsISBN:9781319042578Author:David S. Moore, William I. Notz, Michael A. FlignerPublisher:W. H. Freeman
 Introduction to the Practice of StatisticsStatisticsISBN:9781319013387Author:David S. Moore, George P. McCabe, Bruce A. CraigPublisher:W. H. Freeman
MATLAB: An Introduction with Applications
Statistics
ISBN:9781119256830
Author:Amos Gilat
Publisher:John Wiley & Sons Inc
Probability and Statistics for Engineering and th...
Statistics
ISBN:9781305251809
Author:Jay L. Devore
Publisher:Cengage Learning
Statistics for The Behavioral Sciences (MindTap C...
Statistics
ISBN:9781305504912
Author:Frederick J Gravetter, Larry B. Wallnau
Publisher:Cengage Learning
Elementary Statistics: Picturing the World (7th E...
Statistics
ISBN:9780134683416
Author:Ron Larson, Betsy Farber
Publisher:PEARSON
The Basic Practice of Statistics
Statistics
ISBN:9781319042578
Author:David S. Moore, William I. Notz, Michael A. Fligner
Publisher:W. H. Freeman
Introduction to the Practice of Statistics
Statistics
ISBN:9781319013387
Author:David S. Moore, George P. McCabe, Bruce A. Craig
Publisher:W. H. Freeman