
MATLAB: An Introduction with Applications
6th Edition
ISBN: 9781119256830
Author: Amos Gilat
Publisher: John Wiley & Sons Inc
expand_more
expand_more
format_list_bulleted
Related questions
Question
So question. D ON THE GRAPHICS CALCULATOR .
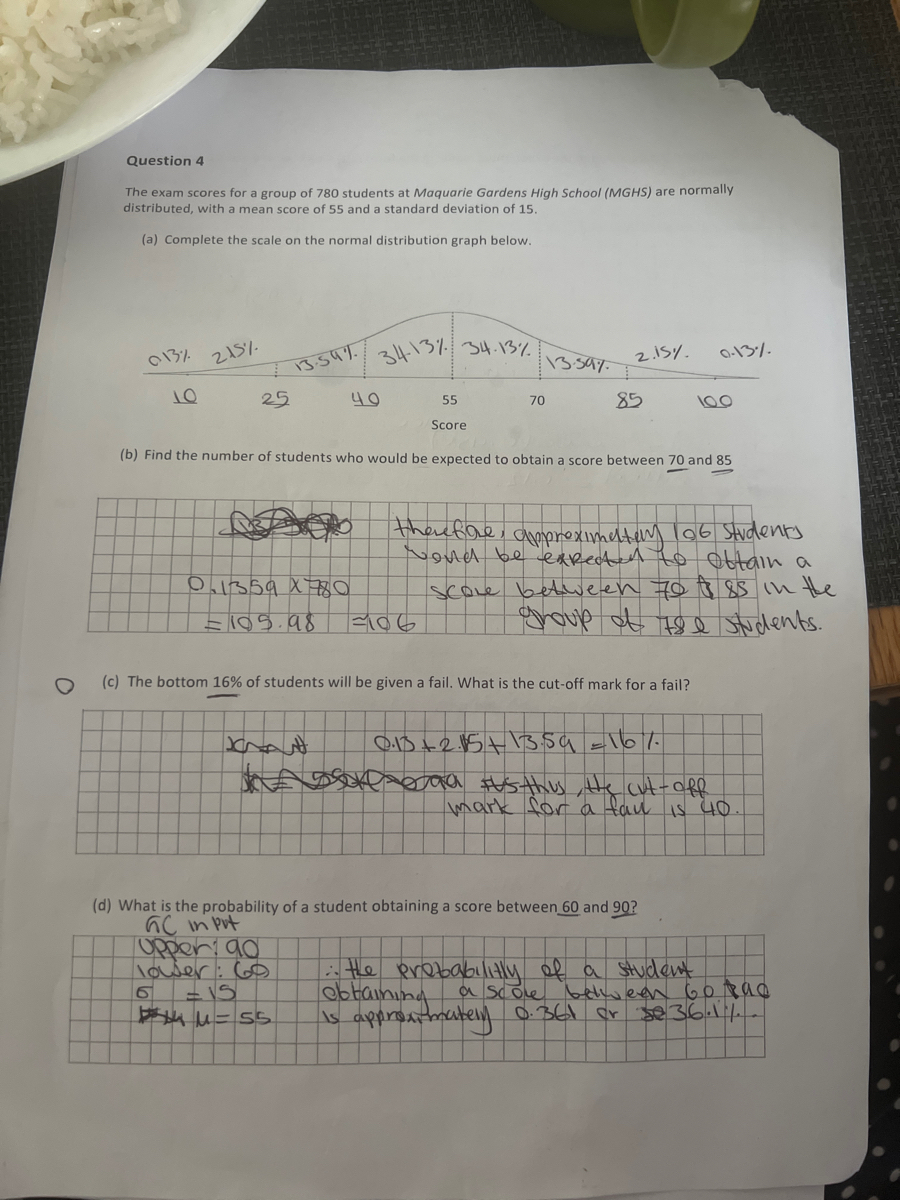

Transcribed Image Text:Question 4
The exam scores for a group of 780 students at Maquarie Gardens High School (MGHS) are normally
distributed, with a mean score of 55 and a standard deviation of 15.
(a) Complete the scale on the normal distribution graph below.
013%
10
215%
25
13.54%
0.1359 x 780
109.98
34-13% 34.13%
40
that
55
Score
70
F186
13.397
2.15%.
85
(b) Find the number of students who would be expected to obtain a score between 70 and 85
(c) The bottom 16% of students will be given a fail. What is the cut-off mark for a fail?
therefore, approximetery 106 Students
wond be expected to obtain a
SCOLe between 70 85 in the
group of the students.
0-13%
100
(d) What is the probability of a student obtaining a score between 60 and 90?
GC in put
upper 90
lower: 60
15
u=55
0.13 +215 +13.59
bad #us thus, the cut-off
mark for a faul is 40.
:: the probability of a student
obtaining
a score between 60 pad
is approximately 0.361 or $@36-11-
Expert Solution
This question has been solved!
Explore an expertly crafted, step-by-step solution for a thorough understanding of key concepts.

Step by stepSolved in 3 steps with 8 images

Knowledge Booster

Similar questions
- I need help making these on Desmos calculator, or I guess really anyway to have these show up in a graphing calculator. Thank you !arrow_forwardPlease answer question 4.1arrow_forwardThe head of the production would like to know how many work hours that the first 55% of the grand pianos need for completion. Use the data from problem 1 to answer this question for her. Please use excel or explain excel input to get answerarrow_forward
- Below is data for two variables, X and Y. Answer the questions that follow. X Y X-MX Y-MY (X-MX)2 (Y-MY)2 (X-MX)(Y-MY) 3 3 -2 -1 4 1 2 4 3 -1 -1 1 1 ___ 6 4 1 ___ 1 0 0 7 6 2 2 ___ 4 4 What is the missing value under the (X-MX)2 column?arrow_forwardBelow is the output from regression. Use the p-value and decide if the equation is good to use for forecasting. Group of answer choices A.) p-value = 82 - equation is good to use B.) p-value = 0.15 - equation is not good to use C.) p-value = 0.18 - equation is not good to use D.) p-value = -16 - equation is good to usearrow_forwardStudents in 5 different 2nd grade classes are timed to see how long it takes to correctly answer 50 addition and subtraction problems. Each class was then taught a different strategy for basic arithmetic for one month. After the month, the students were again timed to see how long it takes to correctly answer 50 similar problems. The dot plots below show the differences in times for the students (difference after before) for each of the five classes. Which dot plot appears to indicate an improvement in time for the class? A B C D 3 -4 000 · goods goxxcomm 0 ... 8.00 88 888 8 8 8 8 。 8 88 000 0 80 800 -2 0 8 01 cooo 2 08 우 O O +-000 8 08...8.... 0 800 6 8 00 10 12arrow_forward
- USE THE INFORMATION BELOW TO ANSWER QUESTIONS 34 THRU 37 The infant mortality rate is expressed as the number of infant deaths per 1000 live births. According to the US Central Intelligence Agency (CIA), which keeps accurate, up-to-date infant mortality statistics throughout the world, in 2019 there were 33 nations with better infant mortality rates than the United States. The US infant mortality rate of 6.22 infant deaths per 1000 live births ranked 34th. It appears that at a certain stage in nations' movement up the socioeconomic scale-after the basic necessities for infant survival (proper nutrition, sanitation, clean water, and access to health care) have been met-a counter-intuitive relationship occurs between best fit line and the number of vaccines given to infants and infant mortality rates: nations with higher (worse) infant mortality rates give their infants, on average, more vaccine doses. This positive correlation, derived from the data elicits an important inquiry: are…arrow_forwardOliver and Tony work at a dentist office. They had a conversation one day about how much time it took to complete a routine cleaning for each patient. Tony wondered if the time since the last visit to the office was related to the length of a cleaning. Oliver went to the filing cabinet and came up with the following data: x = Months since last visit y = Length of cleaning (mins) 6 20 13 49 6 8 9 15 33 35 42 14 7 11 9 55 36 52 29 E SALETSTRANICZON RUSSAREN Co JINSIEMELLETarrow_forwardSuppose that an urban geographer is studying historical changes in housing characteristics in London, England. She wishes to determine if house size (square feet of living area) and the number of years since home construction are associated. What method could she use to learn if such a relationship exists.arrow_forward
arrow_back_ios
arrow_forward_ios
Recommended textbooks for you
- MATLAB: An Introduction with ApplicationsStatisticsISBN:9781119256830Author:Amos GilatPublisher:John Wiley & Sons Inc
 Probability and Statistics for Engineering and th...StatisticsISBN:9781305251809Author:Jay L. DevorePublisher:Cengage Learning
 Statistics for The Behavioral Sciences (MindTap C...StatisticsISBN:9781305504912Author:Frederick J Gravetter, Larry B. WallnauPublisher:Cengage Learning
  Elementary Statistics: Picturing the World (7th E...StatisticsISBN:9780134683416Author:Ron Larson, Betsy FarberPublisher:PEARSON
 The Basic Practice of StatisticsStatisticsISBN:9781319042578Author:David S. Moore, William I. Notz, Michael A. FlignerPublisher:W. H. Freeman
 Introduction to the Practice of StatisticsStatisticsISBN:9781319013387Author:David S. Moore, George P. McCabe, Bruce A. CraigPublisher:W. H. Freeman
MATLAB: An Introduction with Applications
Statistics
ISBN:9781119256830
Author:Amos Gilat
Publisher:John Wiley & Sons Inc
Probability and Statistics for Engineering and th...
Statistics
ISBN:9781305251809
Author:Jay L. Devore
Publisher:Cengage Learning
Statistics for The Behavioral Sciences (MindTap C...
Statistics
ISBN:9781305504912
Author:Frederick J Gravetter, Larry B. Wallnau
Publisher:Cengage Learning
Elementary Statistics: Picturing the World (7th E...
Statistics
ISBN:9780134683416
Author:Ron Larson, Betsy Farber
Publisher:PEARSON
The Basic Practice of Statistics
Statistics
ISBN:9781319042578
Author:David S. Moore, William I. Notz, Michael A. Fligner
Publisher:W. H. Freeman
Introduction to the Practice of Statistics
Statistics
ISBN:9781319013387
Author:David S. Moore, George P. McCabe, Bruce A. Craig
Publisher:W. H. Freeman