MATLAB: An Introduction with Applications
6th Edition
ISBN: 9781119256830
Author: Amos Gilat
Publisher: John Wiley & Sons Inc
expand_more
expand_more
format_list_bulleted
Question
thumb_up100%
Answer parts d,e, and f, please.

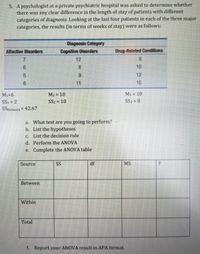
Transcribed Image Text:### Text Transcription:
5. A psychologist at a private psychiatric hospital was asked to determine whether there was any clear difference in the length of stay of patients with different categories of diagnosis. Looking at the last four patients in each of the three major categories, the results (in terms of weeks of stay) were as follows:
#### Diagnosis Category
- **Affective Disorders**
- 7
- 6
- 5
- 6
- \(M_1 = 6\)
- \(SS_1 = 2\)
- **Cognitive Disorders**
- 12
- 8
- 9
- 11
- \(M_2 = 10\)
- \(SS_2 = 10\)
- **Drug-Related Conditions**
- 8
- 10
- 12
- 10
- \(M_3 = 10\)
- \(SS_2 = 8\)
- \(SS_{\text{Between}} = 42.67\)
a. What test are you going to perform?
b. List the hypotheses
c. List the decision rule
d. Perform the ANOVA
e. Complete the ANOVA table
### ANOVA Table Structure:
| Source | SS | df | MS | F |
|---------|-------|------|------|-----|
| Between | | | | |
| Within | | | | |
| Total | | | | |
f. Report your ANOVA result in APA format.
### Analysis:
- The psychologist is expected to perform an ANOVA test to determine if there are statistically significant differences between the means of the three diagnosis categories.
- The hypotheses for ANOVA are typically:
- **Null Hypothesis (H0):** There is no difference in the mean length of stay between the three diagnostic categories.
- **Alternative Hypothesis (H1):** At least one category has a different mean length of stay.
- The decision rule would involve determining the F-critical value from an F-distribution table at a chosen significance level (e.g., 0.05) and comparing it to the calculated F-statistic.
Expert Solution
This question has been solved!
Explore an expertly crafted, step-by-step solution for a thorough understanding of key concepts.
This is a popular solution
Trending nowThis is a popular solution!
Step by stepSolved in 2 steps with 2 images

Knowledge Booster
Similar questions
arrow_back_ios
arrow_forward_ios
Recommended textbooks for you
 MATLAB: An Introduction with ApplicationsStatisticsISBN:9781119256830Author:Amos GilatPublisher:John Wiley & Sons Inc
 Probability and Statistics for Engineering and th...StatisticsISBN:9781305251809Author:Jay L. DevorePublisher:Cengage Learning
 Statistics for The Behavioral Sciences (MindTap C...StatisticsISBN:9781305504912Author:Frederick J Gravetter, Larry B. WallnauPublisher:Cengage Learning
 Elementary Statistics: Picturing the World (7th E...StatisticsISBN:9780134683416Author:Ron Larson, Betsy FarberPublisher:PEARSON
 The Basic Practice of StatisticsStatisticsISBN:9781319042578Author:David S. Moore, William I. Notz, Michael A. FlignerPublisher:W. H. Freeman
 Introduction to the Practice of StatisticsStatisticsISBN:9781319013387Author:David S. Moore, George P. McCabe, Bruce A. CraigPublisher:W. H. Freeman

MATLAB: An Introduction with Applications
Statistics
ISBN:9781119256830
Author:Amos Gilat
Publisher:John Wiley & Sons Inc

Probability and Statistics for Engineering and th...
Statistics
ISBN:9781305251809
Author:Jay L. Devore
Publisher:Cengage Learning

Statistics for The Behavioral Sciences (MindTap C...
Statistics
ISBN:9781305504912
Author:Frederick J Gravetter, Larry B. Wallnau
Publisher:Cengage Learning

Elementary Statistics: Picturing the World (7th E...
Statistics
ISBN:9780134683416
Author:Ron Larson, Betsy Farber
Publisher:PEARSON

The Basic Practice of Statistics
Statistics
ISBN:9781319042578
Author:David S. Moore, William I. Notz, Michael A. Fligner
Publisher:W. H. Freeman

Introduction to the Practice of Statistics
Statistics
ISBN:9781319013387
Author:David S. Moore, George P. McCabe, Bruce A. Craig
Publisher:W. H. Freeman