
MATLAB: An Introduction with Applications
6th Edition
ISBN: 9781119256830
Author: Amos Gilat
Publisher: John Wiley & Sons Inc
expand_more
expand_more
format_list_bulleted
Related questions
Question
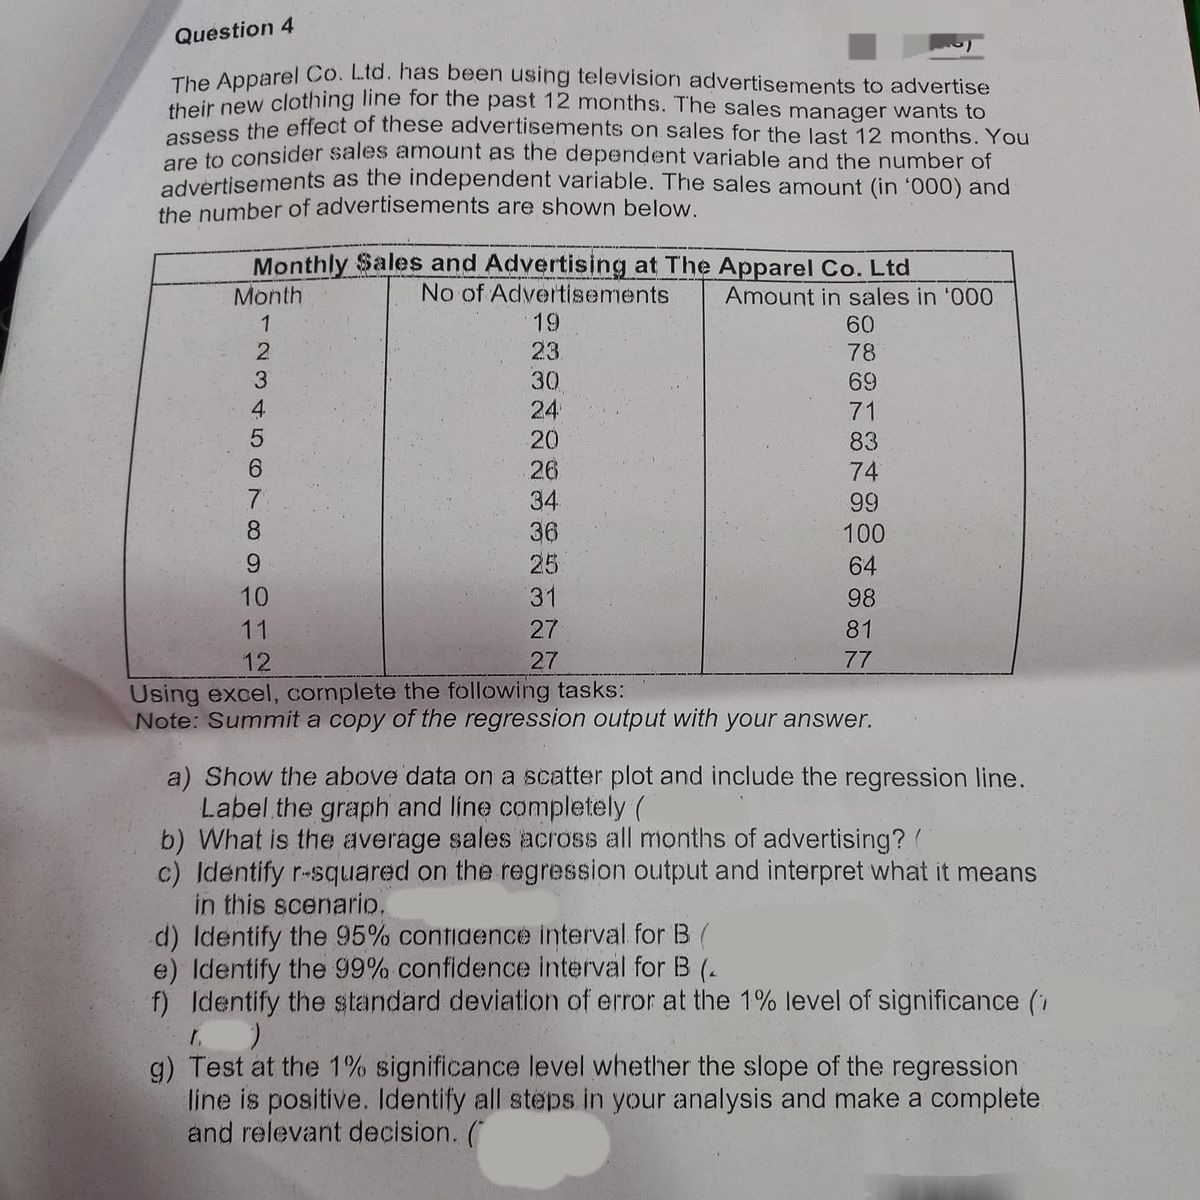

Transcribed Image Text:Question 4
The Apparel Co. Ltd. has been using television advertisements to advertise
hoir new clothing line for the past 12 mmonths. The sales manager wants to
assess the effect of these advertisements on sales for the last 12 months. You
re to consider sales amount as the dependent variable and the number of
advertisements as the independent variable. The sales amount (in '000) and
the number of advertisements are shown below.
Monthly $ales and Advertising at The Apparel Co. Ltd
No of Advertisements
19
23
30
24
20
26
34
36
Month
Amount in sales in '000
1
60
78
69
4
71
83
9.
74
7
99
8
100
25
64
10
31
98
11
27
81
12
27
77
Using excel, complete the following tasks:
Note: Summit a copy of the regression output with your answer.
a) Show the above data on a scatter plot and include the regression line.
Label the graph and líne completely (
b) What is the average sales across all months of advertising?(
c) Identify r-squared on the regression output and interpret what it means
in this scenario.
d) Identify the 95% contidence interval for B(
e) Identify the 99% confidence interval for B (-
f) Identify the standard deviation of error at the 1% level of significance (1
g) Test at the 1% significance level whether the slope of the regression
line is positive. Identify all steps in your analysis and make a complete
and relevant decision. (
Expert Solution
This question has been solved!
Explore an expertly crafted, step-by-step solution for a thorough understanding of key concepts.

Step by stepSolved in 4 steps with 1 images

Knowledge Booster

Similar questions
- please answer the question 1a,b&c and show work!! thank you also please make sure if writing on paper handwriting can be read thank you again :)arrow_forwardShelia's doctor is concerned that she may suffer from gestational diabetes (high blood glucose levels during pregnancy). There is variation both in the actual glucose level and in the blood test that measures the level. A patient is classified as having gestational diabetes if the glucose level is above 140 milligrams per deciliter (mg/dl) one hour after a sugary drink. Shelia's measured glucose level one hour after the sugary drink varies according to the Normal distribution with µ = 124 mg/dl and σ = 13 mg/dl. If a single glucose measurement is made, what is the probability that Shelia is diagnosed as having gestational diabetes?arrow_forwardMAPEH-10-Q3-Week-4.pdfX Filipino-10-Q3-Week-4.pdf X TLE CSS 10 Quarter3 Week X ESP-10-03-Weeks-3-4.pdf Math 10 Q3 Week 5.p sers/L%20E%2ON%200%20V%200%20-%20P%20C/Downloads/Math%2010%20Q3%20Week%205.pdf Facebook - + E| D Page view A Read aloud | Draw E Highlight b. 362 880 b. 181 440 C. 60 480 d. 30 240 3. Abby is selecting 3 desserts from 10 possible choices displayed on the dessert cart at a restaurant. How many selections are there? b. 120 b. 240 C. 360 d. 720 4. A mother, a father, and their 4 children will dine in a restaurant with circular tables. In how many ways can the family be seated in a table? b. 24 b. 56 C. 120 d. 720 5. From a Grade 10 class of 28 students, five representatives are to be chosen for academic competition. In how many ways can students be chosen to represent their class? b. 12 285 b. 19 565 C. 49 140 d. 98 280 6. Mr. Reyes has a vault with four-digit combination lock. He can set the combination himself. He can use the digits 0 - 9. Each digit can be used…arrow_forward
- helparrow_forwardIf another variable systematically co-varies with the independent variable, then we likely have an extraneous variable b. a dependent variable an ex post facto design a confounding variablearrow_forwardFor each of the following pairs of variable, identify the dependent and independent variable.arrow_forward
- Shelia's doctor is concerned that she may suffer from gestational diabetes (high blood glucose levels during pregnancy). There is variation both in the actual glucose level and in the blood test that measures the level. A patient is classified as having gestational diabetes if the glucose level is above 140 milligrams per deciliter one hour after a sugary drink is ingested. Shelia's measured glucose level one hour after ingesting the sugary drink varies according to the Normal distribution with mean 128 mg/dl and standard deviation 9 mg/dl. Let ? denote a patient's glucose level. (a) If measurements are made on four different days, find the level ? such that there is probability only 0.01 that the mean glucose level of four test results falls above ? for Shelia's glucose level distribution. What is the value of ??ANSWER: (b) If the mean result from the four tests is compared to the criterion 140 mg/dl, what is the probability that Shelia is diagnosed as having gestational…arrow_forwardI need help phrasing a quantitative research question. The topic is on Health, it is focused on Widowed Americans as the dependent variable, and their quality of life (Excellent - Poor)as the independent variable. An overlapping variable would be sex (male - female).arrow_forwardA doctor notes the variables listed in the following table from every patient before admitting in his hospital. Which of the following variables are qualitative and which are quantitative? Which qualitative variables are nominal or ordinal? Which quantitative variables are discrete or continuous? ( 1 ) Gender (Male or Female) ( 2 ) Weight (lbs) ( 3 ) Phone Number ( 4 ) Height (cm) ( 5 ) Marital Status (Single, Married, Divorce, Widow) ( 6 ) Systolic Blood Pressure (mm of pressure) ( 7 ) Temperature (degree F) ( 8 ) Level of Calcium (microgram/milimeter) ( 9 ) Family of Income ( Amount) ( 10 ) Wihte Blood Cellsarrow_forward
- Bloomberg Intelligence listed 50 companies to watch in 2018 (www.bloomberg.com/features/companies-to-watch-2018). Twelve of the companies are listed here with their total assets and 12-month sales. Total Assests ($ billions) 134.47 12-Month Sales ($ billions) Total Assests ($ billions) 12-Month Sales Company Eni SpA Discovery Communications Dong Energy Company AMC Entertainment ($ billions) 68.13 6.59 9.81 4.19 16.15 DSV 6.14 10.54 20.5 Alaska Air Boohoo.com 9.16 10.7 6.9 AMD 3.37 4.62 0.235 0.545 25.11 Cabot Oil & Gas 5.22 1.58 Danone 52.12 Engie 166.84 72 Experian 7.69 4.34 E Click here for the Excel Data File a. Draw a scatter diagram. 1. On the graph below, use the point tool to plot the point corresponding to the first Sales and her Earnings Sales1). 2. Repeat the process for the remainder of the sample (Sales 2, Sales 3, ... ). 3. To enter exact coordinates, dooble-click on the point and enter the exact coordinates of x and y. Tools 90 80 point 2 point 3 70 Ch13_40 18e.xlsx…arrow_forwardA patient is classified as having gestational diabetes if their average glucose level is above 140 milligrams per deciliter (mg/dl) one hour after a sugary drink is ingested. Rebecca's doctor is concerned that she may suffer from gestational diabetes. There is variation both in the actual glucose level and in the blood test that measures the level. Rebecca's measured glucose level one hour after ingesting the sugary drink varies according to the Normal distribution with μ=140+5 mg/dl and σ=5+1 mg/dl. Using the Central Limit Theorem, determine the probability of Rebecca being diagnosed with gestational diabetes if her glucose level is measured: Once? n=5+2 times n=5+4 times Comment on the relationship between the probabilities observed in (a), (b), and (c). Explain, using concepts from lecture why this occurs and what it means in context.arrow_forwardPlease no written by hand solutions 3. A researcher is interested in the correlation between a person’s age and the amount of sleep they get. He uses a poll to collect representative data for 2,000 people. The researcher performs a regression, with a dependent variable of minutes per week spent sleeping, and an independent variable of age in years. The regression results are as follows: - (Intercept): 150 - age: -5 Answer the following: - What is the regression line? - What is the predicted number of minutes sleeping for someone who is 20 years old? - The researcher is also interested in the relationship between age, sleep, and politics. Each person who responds to the poll chooses a value for liberal between 0 (very conservative) and 100 (very liberal) to describe their politics. The researcher performs a regression with the same independent variable of minutes per week sleeping, and dependent variables of age and liberal. The regression results are as follows: - (Intercept):…arrow_forward
arrow_back_ios
SEE MORE QUESTIONS
arrow_forward_ios
Recommended textbooks for you
- MATLAB: An Introduction with ApplicationsStatisticsISBN:9781119256830Author:Amos GilatPublisher:John Wiley & Sons Inc
 Probability and Statistics for Engineering and th...StatisticsISBN:9781305251809Author:Jay L. DevorePublisher:Cengage Learning
 Statistics for The Behavioral Sciences (MindTap C...StatisticsISBN:9781305504912Author:Frederick J Gravetter, Larry B. WallnauPublisher:Cengage Learning
  Elementary Statistics: Picturing the World (7th E...StatisticsISBN:9780134683416Author:Ron Larson, Betsy FarberPublisher:PEARSON
 The Basic Practice of StatisticsStatisticsISBN:9781319042578Author:David S. Moore, William I. Notz, Michael A. FlignerPublisher:W. H. Freeman
 Introduction to the Practice of StatisticsStatisticsISBN:9781319013387Author:David S. Moore, George P. McCabe, Bruce A. CraigPublisher:W. H. Freeman
MATLAB: An Introduction with Applications
Statistics
ISBN:9781119256830
Author:Amos Gilat
Publisher:John Wiley & Sons Inc
Probability and Statistics for Engineering and th...
Statistics
ISBN:9781305251809
Author:Jay L. Devore
Publisher:Cengage Learning
Statistics for The Behavioral Sciences (MindTap C...
Statistics
ISBN:9781305504912
Author:Frederick J Gravetter, Larry B. Wallnau
Publisher:Cengage Learning
Elementary Statistics: Picturing the World (7th E...
Statistics
ISBN:9780134683416
Author:Ron Larson, Betsy Farber
Publisher:PEARSON
The Basic Practice of Statistics
Statistics
ISBN:9781319042578
Author:David S. Moore, William I. Notz, Michael A. Fligner
Publisher:W. H. Freeman
Introduction to the Practice of Statistics
Statistics
ISBN:9781319013387
Author:David S. Moore, George P. McCabe, Bruce A. Craig
Publisher:W. H. Freeman