
ENGR.ECONOMIC ANALYSIS
14th Edition
ISBN: 9780190931919
Author: NEWNAN
Publisher: Oxford University Press
expand_more
expand_more
format_list_bulleted
Related questions
Question
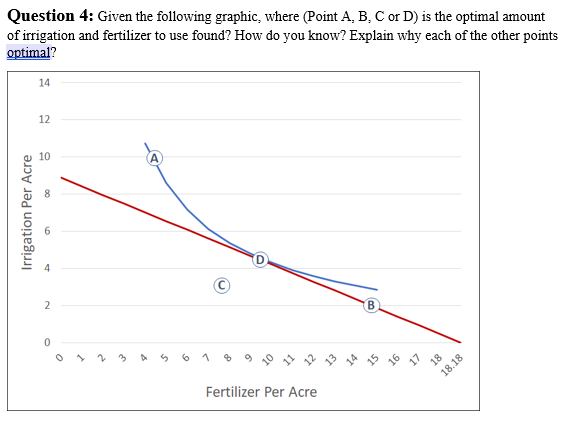

Transcribed Image Text:Question 4: Given the following graphic, where (Point A, B, C or D) is the optimal amount
of irrigation and fertilizer to use found? How do you know? Explain why each of the other points
optimal?
Irrigation Per Acre
14
12
10
2
0
(0)
Fertilizer Per Acre
(∞)
B
18
18.18
Expert Solution
This question has been solved!
Explore an expertly crafted, step-by-step solution for a thorough understanding of key concepts.

This is a popular solution

Trending nowThis is a popular solution!

Step by stepSolved in 3 steps

Knowledge Booster


Learn more about
Need a deep-dive on the concept behind this application? Look no further. Learn more about this topic, economics and related others by exploring similar questions and additional content below.Similar questions
- urgentarrow_forwardWhich of points A–E is the most efficient? Explain.arrow_forwarda) At 200 units of the activity, marginal benefit is $__________ and marginal cost is $__________. b) Adding the 200th unit of the activity causes net benefit to __________ (increase, decrease) by $__________. c) At 700 units of the activity, marginal benefit is $__________ and marginal cost is $__________. d) Subtracting the 700th unit of the activity causes net benefit to __________ (increase, decrease) by $__________. e) The optimal level of the activity is __________units. At the optimal level of the activity, marginal benefit is $__________ and marginal cost is $__________.arrow_forward
- e Price -Q₁ Quantity Which of the following scenarios is BEST represented in the graph? A number of sellers increase B decrease in government taxes C resource costs increase D technology improvesarrow_forwardtype plzarrow_forward8. Factors of production can be: (a) Land (b) Labour (c) Organisation (d) All of the abovearrow_forward
- In economics, the terms efficient, effective and productive are often known. Question: a. Explain the difference between each of these terms. Explain with examples b. How many types of efficiency are there? Explain the difference between each! c. If the results of the rice production model are as follows: Qp = 0.031 + 0.046 Land Area + 0.092 Seed + 0.198 TK + 0.728 Fertilizer + 0.222 Perticide. Explain the results of the analysis related to the concept of efficiency for each variable and return of scalearrow_forwardSpecify and explain the typical shapes of marginal-benefifit and marginal-cost curves. How are these curves used to determine the optimal allocation of resources to a particular product? If current output is such that marginal cost exceeds marginal benefifit, should more or fewer resources be allocated to this product? Explain.arrow_forward(a) Suppose that the 149 million square kilometers of land on the surface of the population of 7 billion people in late 2011 or early 2012. population of 7 billion people in late 2011 or early 2012. 4. According to the United Nations Population Fund (UNFPA), the world reached a (a) Suppose that the 149 million square kilometers of land on the surface of the earth was divided equally among this population, so that each person was allotted a square parcel of land How long would the sides of each square parcel be? (b) According to the United Nations Food and Agriculture Organization (FAO), only about 32% of the surface of the earth is considered arable and suitable for farming. If only the arable land was divided into equal square parcels among the population, how long would the sides of each square parcel be? (c) Express your answers to parts (a) and (b) in terms of some concrete unit of length. For instance, you might compare them to the height of the Empire State Building, the span of…arrow_forward
- You have a field on which you can grow two types of crops, barley and wheat. The field has 30 acres and each acre can produce 2 wheat or 3 barley. Suppose you are producing 60 barley and it is economically efficient for you to do so. How much wheat are you producing? 5 wheat 10 wheat 15 wheat 20 wheatarrow_forwardQuestion 2: Suppose you have the following information about the demand and supply of cotton in the U.S.: Price 9 15 25 35 U.S. Supply 4 12 17 U.S. Demand 40 36 30 20 10 (a) Determine the equations of the supply and demand curves. Assume that the two equations are linear. (b) Determine the market equilibrium price and quantity. (c) Now suppose that the US can import an arbitrary quantity of cotton at a price of 15 Dollars. How many units will the U.S. import?arrow_forward
arrow_back_ios
arrow_forward_ios
Recommended textbooks for you
 Principles of Economics (12th Edition)EconomicsISBN:9780134078779Author:Karl E. Case, Ray C. Fair, Sharon E. OsterPublisher:PEARSON
 Engineering Economy (17th Edition)EconomicsISBN:9780134870069Author:William G. Sullivan, Elin M. Wicks, C. Patrick KoellingPublisher:PEARSON
 Principles of Economics (MindTap Course List)EconomicsISBN:9781305585126Author:N. Gregory MankiwPublisher:Cengage Learning
 Managerial Economics: A Problem Solving ApproachEconomicsISBN:9781337106665Author:Luke M. Froeb, Brian T. McCann, Michael R. Ward, Mike ShorPublisher:Cengage Learning
 Managerial Economics & Business Strategy (Mcgraw-...EconomicsISBN:9781259290619Author:Michael Baye, Jeff PrincePublisher:McGraw-Hill Education
Principles of Economics (12th Edition)
Economics
ISBN:9780134078779
Author:Karl E. Case, Ray C. Fair, Sharon E. Oster
Publisher:PEARSON
Engineering Economy (17th Edition)
Economics
ISBN:9780134870069
Author:William G. Sullivan, Elin M. Wicks, C. Patrick Koelling
Publisher:PEARSON
Principles of Economics (MindTap Course List)
Economics
ISBN:9781305585126
Author:N. Gregory Mankiw
Publisher:Cengage Learning
Managerial Economics: A Problem Solving Approach
Economics
ISBN:9781337106665
Author:Luke M. Froeb, Brian T. McCann, Michael R. Ward, Mike Shor
Publisher:Cengage Learning
Managerial Economics & Business Strategy (Mcgraw-...
Economics
ISBN:9781259290619
Author:Michael Baye, Jeff Prince
Publisher:McGraw-Hill Education