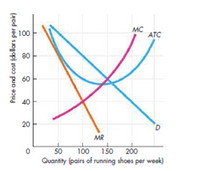
Question 3: The situation facing by firm “Smart”, a producer of running shoes, is shown in the following figure.
Figure attached and can see in end
- What quantity does Smart Shoes produce?
Answer:
2. What is the
Answer:
3. What is Smart’s economic
Answer:
4. Why MR curve is below to demand curve?
Answer:
Question 4: In the market for running shoes, all the firms face a similar demand curve and have similar cost curves to those of Smart in question 3.
a.) What happens to the number of firms producing running shoes in the long run?
Answer:
b.) What happens to the price of running shoes in the long run?
Answer:
c.) What happens to the quantity of running shoes produced by Smart in the long run?
Answer:
d.) What happens to the quantity of running shoes in the entire market in the long run?
Answer:
e. ) Does Smart shoes have excess capacity in the long run?
Answer:
f.) Why, if Smart firm shoes has excess capacity in the long run, doesn’t the firm decrease its capacity?
Answer:
G.) What is the relationship between Smart Shoes’ price and marginal cost?
Answer:

Trending nowThis is a popular solution!
Step by stepSolved in 2 steps with 3 images

- Briefly explain the reason for why in a competitive market we expect economic profits to be zero inthe long run. Why do firms operate even though they face 0 economic profit?arrow_forwardWhat are the three conditions for a market to be perfectly competitive? For a market to be perfectly competitive, there must be A. many buyers and sellers, with all firms selling identical products, and no barriers to new firms entering the market. B. many buyers and nothingsellers, with all firms selling identical products, and substantial barriers to new firms entering the market. C. many buyers and sellers, with firms selling similar but not identical products, with low barriers to new firms entering the market. D. many buyers and one seller, with the firm producing a product that has no close substitutes, and barriers to new firms entering the market.arrow_forwardSuppose the graph depicts the marginal cost (MC) curves of two profit maximizing Texas cotton farmers, Jesse and Neal. Assume Jesse and Neal sell their cotton in the same competitive market. What is the most efficient way for Jesse and Neal to produce a total of 1200 bales of cotton? Jesse's optimal output: Neal's optimal output: 400 Incorrect 200 Incurrect bales bales Price and cost $10- 9- 8- 7- 6- MC MC 0 100 200 300 400 500 600 700 800 900 1000 Bales of cottonarrow_forward
- not use ai please don'tarrow_forwardUse the figure below, which shows the situation facing Mike’s Bikes, to answer the questions below. The demand and costs of other mountain bike producers are similar to those of Mike’s Bikes. What quantity does the firm produce and what is its price? Calculate the firm’s economic profit or economic loss. What will happen to the number of firms producing mountain bikes in the long run? How will the price of a mountain bike and the number of bikes produced by Mike’s Bikes change in the long run? How will the quantity of mountain bikes produced by all firms change in the long run? Is there any way for Mike’s Bikes to avoid having excess capacity in the long run? Is the market for mountain bikes efficient or inefficient in the long run? Explain your answer.arrow_forwardTom, a math major, examines Jane's economics class notes and observes that when price-taking firms earn economic profit, they do not seem to produce a quantity that minimizes theircosts. Is he correct?Is there significance to this observation?arrow_forward
- 8. Suppose the book-printing industry is competitive and begins in long-run equilibrium. a. Draw a diagram describing the typical firm in the industry. b. Hi-Tech Printing Company invents a new process that sharply reduces the cost of printing books. What hap- pens to Hi-Tech's profits and the price of books in the short run when Hi-Tech's patent prevents other firms from using the new technology? c. What happens in the long run when the patent expires and other firms are free to technology? 1 use thearrow_forwardCan you create a graph showing perfect competition for grocery stores in a rural area ? And explain the graph?arrow_forwardplease answer parts e, f, and garrow_forward
- Note: don't use any ai bots.arrow_forwardThe firm depicted by the graph below is producing q0 level of output. Given its costs, is the firm producing at the profit-maximizing/loss minimizing level of output? Briefly explain why or why not.arrow_forwardThe figure is not finished but how will you draw the long run equilbirum at the price of $100 on this?arrow_forward

 Principles of Economics (12th Edition)EconomicsISBN:9780134078779Author:Karl E. Case, Ray C. Fair, Sharon E. OsterPublisher:PEARSON
 Engineering Economy (17th Edition)EconomicsISBN:9780134870069Author:William G. Sullivan, Elin M. Wicks, C. Patrick KoellingPublisher:PEARSON
 Principles of Economics (MindTap Course List)EconomicsISBN:9781305585126Author:N. Gregory MankiwPublisher:Cengage Learning
 Managerial Economics: A Problem Solving ApproachEconomicsISBN:9781337106665Author:Luke M. Froeb, Brian T. McCann, Michael R. Ward, Mike ShorPublisher:Cengage Learning
 Managerial Economics & Business Strategy (Mcgraw-...EconomicsISBN:9781259290619Author:Michael Baye, Jeff PrincePublisher:McGraw-Hill Education


