
Micro Economics For Today
10th Edition
ISBN: 9781337613064
Author: Tucker, Irvin B.
Publisher: Cengage,
expand_more
expand_more
format_list_bulleted
Question
not use ai please don't
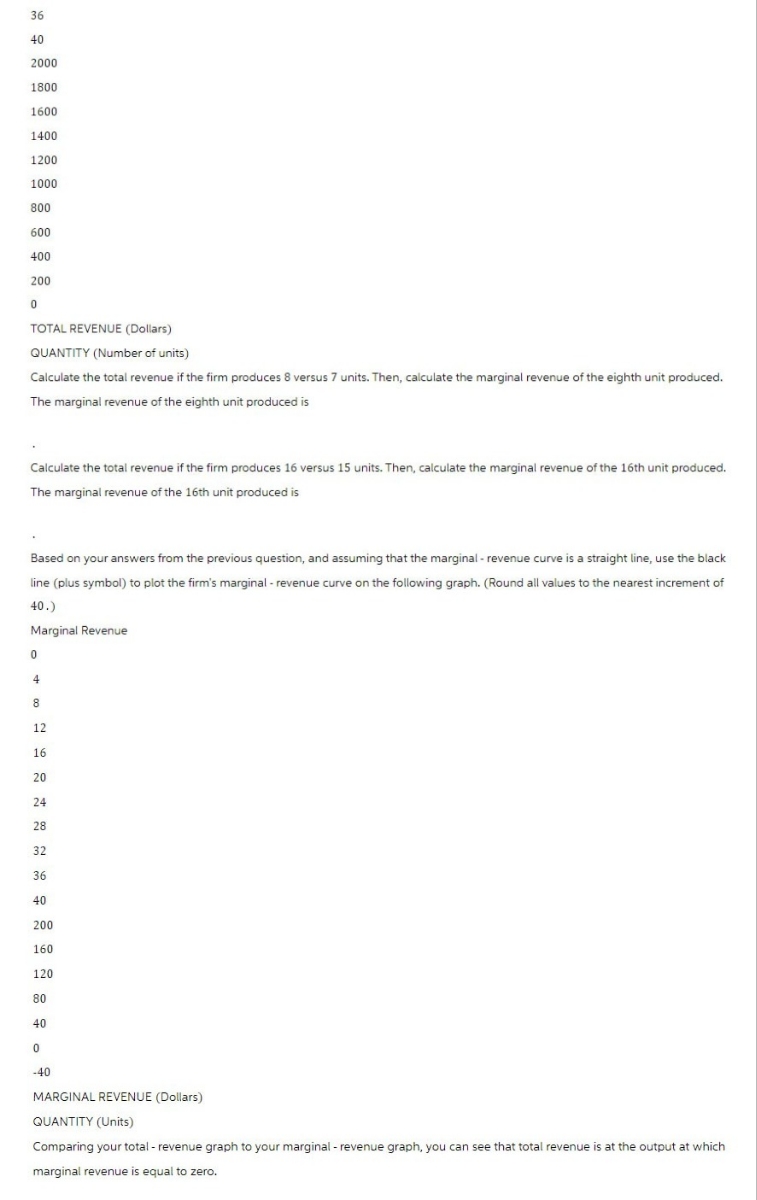

Transcribed Image Text:36
40
2000
1800
1600
1400
1200
1000
800
600
400
200
0
TOTAL REVENUE (Dollars)
QUANTITY (Number of units)
Calculate the total revenue if the firm produces 8 versus 7 units. Then, calculate the marginal revenue of the eighth unit produced.
The marginal revenue of the eighth unit produced is
Calculate the total revenue if the firm produces 16 versus 15 units. Then, calculate the marginal revenue of the 16th unit produced.
The marginal revenue of the 16th unit produced is
Based on your answers from the previous question, and assuming that the marginal - revenue curve is a straight line, use the black
line (plus symbol) to plot the firm's marginal - revenue curve on the following graph. (Round all values to the nearest increment of
40.)
Marginal Revenue
0
4
8
200
160
120
80
40
ཆ ཤ ཤྲཱ ཋ ཟླ ཨྰ # ༞ བྷྲ ༔ བྷྲ ཐྰ ྴ。 ྴ
12
16
20
24
28
32
36
40
0
-40
MARGINAL REVENUE (Dollars)
QUANTITY (Units)
Comparing your total - revenue graph to your marginal - revenue graph, you can see that total revenue is at the output at which
marginal revenue is equal to zero.

Transcribed Image Text:Calculating marginal revenue from a linear demand curve
The blue curve on the following graph represents the demand curve facing a firm that can set its own prices.
Use the graph input tool to help you answer the following questions. You will not be graded on any changes you make to this graph.
Note: Once you enter a value in a white field, the graph and any corresponding amounts in each grey field will change accordingly.
0
4
8
12
16
20
24
28
32
36
40
200
180
160
140
120
100
80
60
40
20
0
PRICE (Dollars per unit)
QUANTITY (Units)
Demand
Graph Input Tool
Market for Goods
Quantity Demanded
(Units)
20
Demand Price
(Dollars per unit)
100.00
On the previous graph, change the number found in the Quantity Demanded field to determine the prices that correspond to the
production of 0, 8, 16, 20, 24, 32, or 40 units of output. Calculate the total revenue for each of these production levels. Then, on the
following graph, use the green points (triangle symbol) to plot the results.
Total Revenue
0
4
8
12
16
20
24
28
32
Expert Solution
This question has been solved!
Explore an expertly crafted, step-by-step solution for a thorough understanding of key concepts.

Step by stepSolved in 2 steps with 2 images

Knowledge Booster

Similar questions
- The following graph shows the daily demand curve for bippitybops in Denver. Use the green rectangle (triangle symbols) to compute total revenue at various prices along the demand curve. Note: You will not be graded on any changes made to this graph. PRICE (Dollars per bippitybop) 240 220 200 180 160 140 120 100 80 8 60 40 20 0 mớ H + 0 9 18 27 36 45 54 63 72 81 QUANTITY (Bippitybops per day) * Demand 90 B 99 108 Total Revenue (?)arrow_forwardThe following graph illustrates the weekly demand curve for motorized scooters in Roanoke. Use the green rectangle (triangle symbols) to compute total revenue at various prices along the demand curve. Note: You will not be graded on any changes made to this graph. PRICE (Dollars per scooter) 260 240 220 200 180 160 140 120 100 80 60 40 20 0 0 9 18 27 A X B Demand 36 45 54 63 72 81 QUANTITY (Scooters) 90 99 108 117 Total Revenue ?arrow_forwardOnly typed answerarrow_forward
- The following graph illustrates the weekly demand curve for motorized scooters in Moline. Use the green rectangle (triangle symbols) to compute total revenue at various prices along the demand curve. Note: You will not be graded on any changes made to this graph. PRICE (Dollars per scooter) 195 180 165 150 135 120 105 90 75 60 45 30 15 0 + + 0 3 6 9 A B Demand ++ 12 15 18 21 24 27 30 QUANTITY (Scooters) 33 36 39 22 Total Revenue ?arrow_forwardThe following graph shows the daily demand curve for bippitybops in Detroit. Use the green rectangle (triangle symbols) to compute total revenue at various prices along the demand curve. Note: You will not be graded on any changes made to this graph. PRICE (Dollars per bippitybop) OTAL REVENUE (Dollars) 2400 1600 100 90 1200 80 1000 70 800 60 50 40 30 20 2200 + 10 2000 + 1800 + 0 1400 + Calculate the daily total revenue when the market price is $90, $80, $70, $60, $50, $40, $30, and $20 per bippitybop. Then, use the green point (triangle symbol) to plot the daily total revenue against quantity corresponding to these market prices on the following graph. (?) 0 ** B Demand 80 10 20 30 40 50 60 70 QUANTITY (Bippitybops per day) 90 100 Total Revenue A ? Total Revenuearrow_forwardOnly typed solutionarrow_forward
- G, 12 Economicsarrow_forward6. Elasticity and total revenue I The following graph shows the daily demand curve for bippitybops in Vancouver. On the following graph, use the green rectangle (triangle symbols) to shade the area representing total revenue at various prices along the demand curve. Notice that when you click on the rectangle, the area is displayed. Note: You will not be scored on any changes made to this graph. PRICE (Dollars per bippitybop) 240 220 200 180 160 140 120 100 80 60 40 20 0 0 6 12 ** + 48 B 18 24 30 36 QUANTITY (Bippitybops per day) Demand 54 80 72 Total Revenue ?arrow_forwardNot sure what steps would be right to be able to solvearrow_forward
- Only typed answerarrow_forwardAll information includedarrow_forwardAruna owns Pottery Plus, a small firm that produces terra cotta pots for sale in the Edmonton area. The graph below shows Aruna's demand curve. Price ($) 40 36 32 28 24 20 16 12 8 4 8 12 16 20 24 28 32 36 40 Quantity per period Search 3 of 6 SAMSUNG Next > 4arrow_forward
arrow_back_ios
SEE MORE QUESTIONS
arrow_forward_ios
Recommended textbooks for you

