
MATLAB: An Introduction with Applications
6th Edition
ISBN: 9781119256830
Author: Amos Gilat
Publisher: John Wiley & Sons Inc
expand_more
expand_more
format_list_bulleted
Related questions
Question

Transcribed Image Text:Question 20
<.
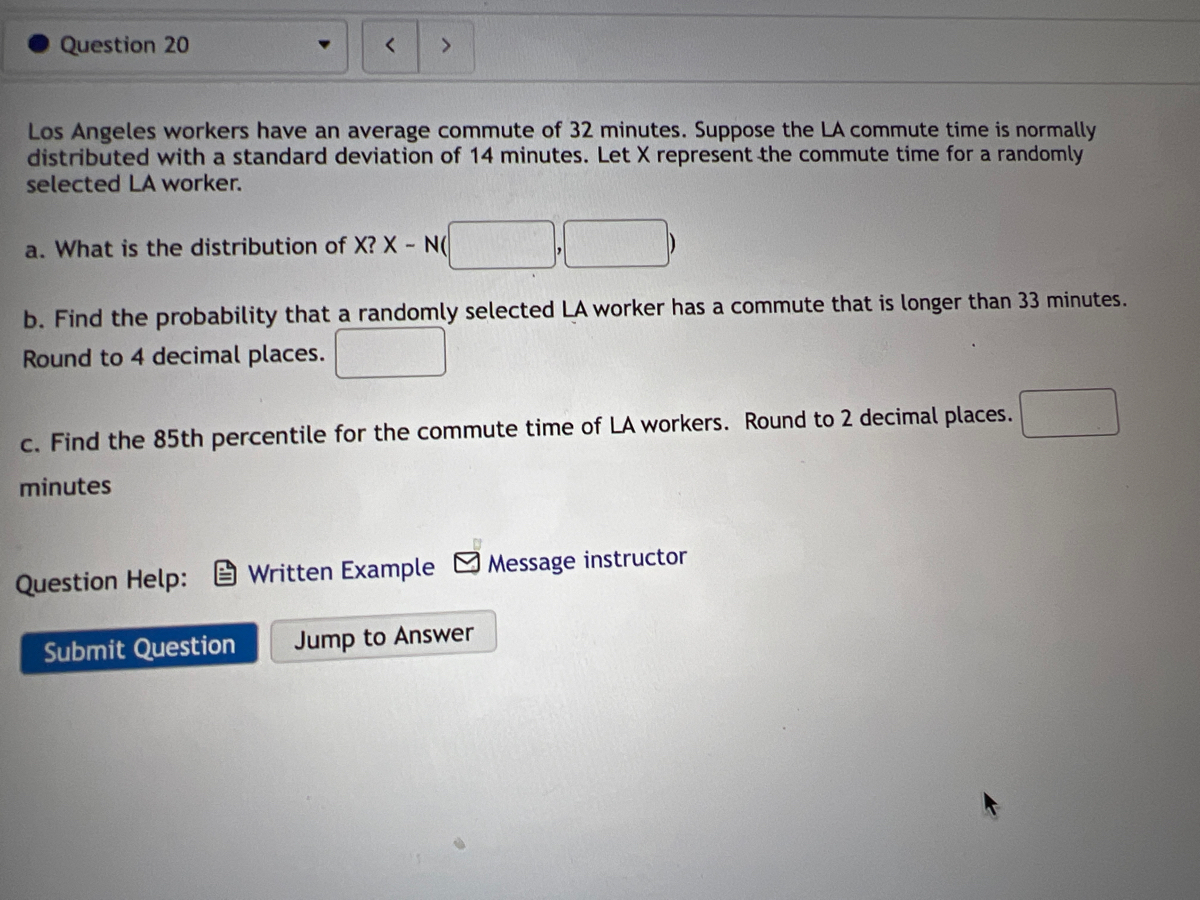
Los Angeles workers have an average commute of 32 minutes. Suppose the LA commute time is normally
distributed with a standard deviation of 14 minutes. Let X represent the commute time for a randomly
selected LA worker.
a. What is the distribution of X? X N(
b. Find the probability that a randomly selected LA worker has a commute that is longer than 33 minutes.
Round to 4 decimal places.
c. Find the 85th percentile for the commute time of LA workers. Round to 2 decimal places.
minutes
Question Help:
Written Example MMessage instructor
Submit Question
Jump to Answer
Expert Solution
This question has been solved!
Explore an expertly crafted, step-by-step solution for a thorough understanding of key concepts.

This is a popular solution

Trending nowThis is a popular solution!

Step by stepSolved in 4 steps

Knowledge Booster

Similar questions
- Please answer B, C, & D.arrow_forwardAssume that adults have IQ scores that are normally distributed with a mean of μ = 105 and a standard deviation o=20. Find the probability that a randomly selected adult has an IQ between 88 and 122. Click to view page 1 of the table. Click to view page 2 of the table. The probability that a randomly selected adult has an IQ between 88 and 122 is (Type an integer or decimal rounded to four decimal places as needed.) Carrow_forwardSuppose that the value of stock varies each day from $14 to $25 with a uniform distribution. Find quartile 1arrow_forward
- Suppose that the distance of fly balls hit to the outfield (in baseball) is normally distributed with a mean of 268 feet and a standard deviation of 43 feet. Let X be the distance in feet for a fly ball. a. What is the distribution of X? X - N( b. Find the probability that a randomly hit fly ball travels less than 219 feet. Round to 4 decimal places. c. Find the 75th percentile for the distribution of distance of fly balls. Round to 2 decimal places. feetarrow_forwardThe average number of kilos of meat a person consumes in a year is 90 kilos. Assume that the standard deviation is 10 kilos and the distribution is approximately normal. If a sample of 45 individuals is selected, find the probability that the mean of the sample will be 87 kilos or greater per year. Express your answer in percent form with 2 decimal places (with percent symbol - e.g. 10.00%) type your answer...arrow_forwarduppose that the distance of fly balls hit to the outfield (in baseball) is normally distributed with a mean of 269 feet and a standard deviation of 43 feet. Let X be the distance in feet for a fly ball.b. Find the probability that a randomly hit fly ball travels less than 307 feet. Round to 4 decimal places. c. Find the 90th percentile for the distribution of distance of fly balls. Round to 2 decimal places. feetarrow_forward
- Please answer B & C.arrow_forwardThe average number of kilos of meat a person consumes in a year is 100 kilos. Assume that the standard deviation is 11 kilos and the distribution is approximately normal. If a sample of 40 individuals is selected, find the probability that the mean of the sample will be 105 kilos or greater per year. Express your answer in percent form with 2 decimal places (with the percent symbol - e.g. 10.00%). type your answer... Nextarrow_forwardAssume that the heights of women are normally distributed with a mean of 63.6 inches and a standard deviation of 2.5 inches. If 100 women are randomly selected, find the probability that they have a mean height greater than 63.0 inches. O A. 0.9918 O B. 0.0082 O C. 0.2881 O D. 0.8989 ick to select your answer. DELLarrow_forward
arrow_back_ios
arrow_forward_ios
Recommended textbooks for you
- MATLAB: An Introduction with ApplicationsStatisticsISBN:9781119256830Author:Amos GilatPublisher:John Wiley & Sons Inc
 Probability and Statistics for Engineering and th...StatisticsISBN:9781305251809Author:Jay L. DevorePublisher:Cengage Learning
 Statistics for The Behavioral Sciences (MindTap C...StatisticsISBN:9781305504912Author:Frederick J Gravetter, Larry B. WallnauPublisher:Cengage Learning
  Elementary Statistics: Picturing the World (7th E...StatisticsISBN:9780134683416Author:Ron Larson, Betsy FarberPublisher:PEARSON
 The Basic Practice of StatisticsStatisticsISBN:9781319042578Author:David S. Moore, William I. Notz, Michael A. FlignerPublisher:W. H. Freeman
 Introduction to the Practice of StatisticsStatisticsISBN:9781319013387Author:David S. Moore, George P. McCabe, Bruce A. CraigPublisher:W. H. Freeman
MATLAB: An Introduction with Applications
Statistics
ISBN:9781119256830
Author:Amos Gilat
Publisher:John Wiley & Sons Inc
Probability and Statistics for Engineering and th...
Statistics
ISBN:9781305251809
Author:Jay L. Devore
Publisher:Cengage Learning
Statistics for The Behavioral Sciences (MindTap C...
Statistics
ISBN:9781305504912
Author:Frederick J Gravetter, Larry B. Wallnau
Publisher:Cengage Learning
Elementary Statistics: Picturing the World (7th E...
Statistics
ISBN:9780134683416
Author:Ron Larson, Betsy Farber
Publisher:PEARSON
The Basic Practice of Statistics
Statistics
ISBN:9781319042578
Author:David S. Moore, William I. Notz, Michael A. Fligner
Publisher:W. H. Freeman
Introduction to the Practice of Statistics
Statistics
ISBN:9781319013387
Author:David S. Moore, George P. McCabe, Bruce A. Craig
Publisher:W. H. Freeman