
ENGR.ECONOMIC ANALYSIS
14th Edition
ISBN: 9780190931919
Author: NEWNAN
Publisher: Oxford University Press
expand_more
expand_more
format_list_bulleted
Related questions
Question

Transcribed Image Text:Question 14
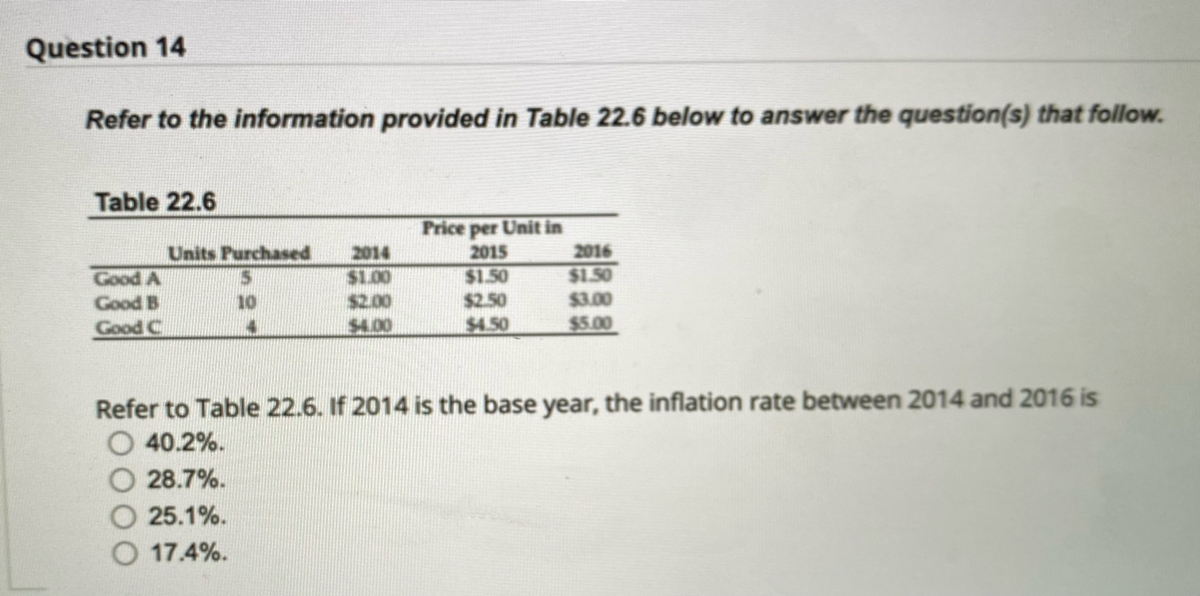
Refer to the information provided in Table 22.6 below to answer the question(s) that follow.
Table 22.6
Price per Unit in
2014
Units Purchased
5.
2015
2016
$1.00
$2.00
$4.00
$1.50
$2.50
$1.50
$3.00
Good A
Good B
10
Good C
$4.50
$5.00
Refer to Table 22.6. If 2014 is the base year, the inflation rate between 2014 and 2016 is
40.2%.
28.7%.
25.1%.
17.4%.
Expert Solution
This question has been solved!
Explore an expertly crafted, step-by-step solution for a thorough understanding of key concepts.

This is a popular solution

Trending nowThis is a popular solution!

Step by stepSolved in 2 steps

Knowledge Booster


Learn more about
Need a deep-dive on the concept behind this application? Look no further. Learn more about this topic, economics and related others by exploring similar questions and additional content below.Similar questions
- Refer to the information provided in Table 7.5 below to answer the questions that follow. Table 7.5 Price per Unitin 2013 $2.00 $2.00 Units Purchased 2015 2014 $2.00 $2.50 2016 $2.40 Blueberries $2.10 Pineapples Cheese $2.50 $3.00 3 $2.50 $3.00 $3.50 $4.00 Refer to Table 7.5. If 2015 is the base year, the price index in 2015 is Select one: a. 100. b. 10. O c. 1. O d. 1000.arrow_forwardGraces Mino Te Mino Te × Login X ° Mail-Jak x Sign in x IN Graces ng.cengage.com/static/nb/ui/evo/index.html?deploymentId=6099182525254170015498996835&elSBN 978 CENGAGE MINDTAP Chapter 11 Homework Back to Assignment Attempts Average/2 2. Alternative price indexes Because there isn't one single measure of inflation, the government and researchers use a variety of methods to get the most balanced picture of how prices fluctuate in the economy. Two of the most commonly used price indexes are the consumer price index (CPI) and the GDP deflator. The GDP deflator for this year is calculated by dividing the However, the CPI reflects only the prices of all goods and services using using by the and multiplying by 100. Indicate whether each scenario will affect the GDP deflator or the CPI for the United States. Check all that apply. Scenario An increase in the price of a Smooth Streets Industries pothole puncher, which is commercial construction equipment made in the U.S. but not bought by U.S.…arrow_forwardPurchase of tables and chairs by a restaurant is ___________ expenditurearrow_forward
- The table below lists the prices from last year and the base year for a college-related basket of goods. Assume that the typical basket of goods for a college student consists of 190 gallons of gas, 65 pizzas, 50 6-packs, and 4 textbooks. Basket of College-Related Goods Basket of Goods Gasoline (per gallon) Pizza (per pizza) Beer (per 6-pack)> Textbook (per book) Price Base Year (dollars) $ 1.50 3.90 4.00 96.00 Price Last Year (dollars) $ 1.90 7.75 6.76 225.00 Instructions: Round your answers to two decimal places. a. Using the values above, what is the rate of inflation between the base year and last year? % b. Assume that rather than buying textbooks for their courses last year, all students decided to buy online access cards at $105 per textbook. What is the rate of inflation between the base year and last year now? %arrow_forward3. Supply and demand for loanable funds The following graph shows the market for loanable funds in a closed economy. The upward-sloping orange line represents the supply of loanable funds, and the downward-sloping blue line represents the demand for loanable funds. Supply Demand 100 200 300 400 500 LOANABLE FUNDS (Billions of dollars) A INTEREST RATE (Percent) m 0 0 600arrow_forwarde Price -Q₁ Quantity Which of the following scenarios is BEST represented in the graph? A number of sellers increase B decrease in government taxes C resource costs increase D technology improvesarrow_forward
- We write the change in total revenue with respect to change in price as dTR/dP. What is the correct expression in the right side of the following equation? dTR/dP= A.) Q(1-n) B.) Q(1+n) C.) Q[1-(1/n)] D.) Q[1+(1/n)]arrow_forwardA Moving to another question will save this response. Question 4 Refer to the information provided in Table 22.5 below to answer the question(s) that follow. Table 22.5 Price per Unit in 2014 2015 $2.00 Units Purchased 2013 $2.00 $2.00 $2.50 2016 $2.10 $2.40 $2.50 $3.50 $4.00 Blueberries 8 Pineapples $2.50 $3.00 Cheese 3 $3.00 Refer to Table 22.5. If 2014 is the base year, the consumer price index in 2013 is 0.893. 0.96. 1.04. 1.119.arrow_forwardSuppose that you are considering whether to enroll in a summer computer-training program that costs $3,600. If you take the program, you will have to give up $1,800 of earnings from your summer job. You figure that the program will increase your earnings by $600 per year for each of the next 10 years. Beyond that, it is not expected to affect your earnings. Suppose the interest rate is 10% Use the preceding information to calculate the present value of the wage increase resulting from the training program. Then decide whether the investment is worthwhile, given the present value of the cost of the training program. At this interest rate, the present value of the increase in wages is about the training. Thus, from a strictly monetary viewpoint, you than the present value of the total cost of , which is participate in the training program.arrow_forward
- Suppose that the manufacturer of a gas clothes dryer has found that when the unit price is p dollars, the revenue R (in dollars) is R(p) = -5p² + 10,000p. (a) At what prices p is revenue zero? (b) For what range of prices will revenue exceed $1,500,000? (a) At what prices p is revenue zero? The revenue equals zero when p is $ (Use a comma to separate answers, but do not use commas in any individual numbers.) (b) For what range of prices will revenue exceed $1,500,000? (Type your answer in interval notation. Round to the nearest cent as needed.).arrow_forward4, 5, 6, 8, and 10 units of output. Calculate the total revenue for each of these production levels. Then, on the following graph, use the green points (triangle symbol) to plot the results. TOTAL REVENUE (Dollars) 500 450 400 300 250 200 150 100 ༔ ཧྭ ༔ ༔ ༔་༔་༔༞༄ 8 50 0 A 0 1 2 3 4 5 6 7 8 9 10 QUANTITY (Number of units) Total Revenue ? Calculate the total revenue if the firm produces 2 versus 1 units. Then, calculate the marginal revenue of the second unit produced. The marginal revenue of the second unit produced is $arrow_forward
arrow_back_ios
arrow_forward_ios
Recommended textbooks for you
 Principles of Economics (12th Edition)EconomicsISBN:9780134078779Author:Karl E. Case, Ray C. Fair, Sharon E. OsterPublisher:PEARSON
 Engineering Economy (17th Edition)EconomicsISBN:9780134870069Author:William G. Sullivan, Elin M. Wicks, C. Patrick KoellingPublisher:PEARSON
 Principles of Economics (MindTap Course List)EconomicsISBN:9781305585126Author:N. Gregory MankiwPublisher:Cengage Learning
 Managerial Economics: A Problem Solving ApproachEconomicsISBN:9781337106665Author:Luke M. Froeb, Brian T. McCann, Michael R. Ward, Mike ShorPublisher:Cengage Learning
 Managerial Economics & Business Strategy (Mcgraw-...EconomicsISBN:9781259290619Author:Michael Baye, Jeff PrincePublisher:McGraw-Hill Education
Principles of Economics (12th Edition)
Economics
ISBN:9780134078779
Author:Karl E. Case, Ray C. Fair, Sharon E. Oster
Publisher:PEARSON
Engineering Economy (17th Edition)
Economics
ISBN:9780134870069
Author:William G. Sullivan, Elin M. Wicks, C. Patrick Koelling
Publisher:PEARSON
Principles of Economics (MindTap Course List)
Economics
ISBN:9781305585126
Author:N. Gregory Mankiw
Publisher:Cengage Learning
Managerial Economics: A Problem Solving Approach
Economics
ISBN:9781337106665
Author:Luke M. Froeb, Brian T. McCann, Michael R. Ward, Mike Shor
Publisher:Cengage Learning
Managerial Economics & Business Strategy (Mcgraw-...
Economics
ISBN:9781259290619
Author:Michael Baye, Jeff Prince
Publisher:McGraw-Hill Education