
MATLAB: An Introduction with Applications
6th Edition
ISBN: 9781119256830
Author: Amos Gilat
Publisher: John Wiley & Sons Inc
expand_more
expand_more
format_list_bulleted
Related questions
Concept explainers
Question

Transcribed Image Text:"UOISSIUOns au 10
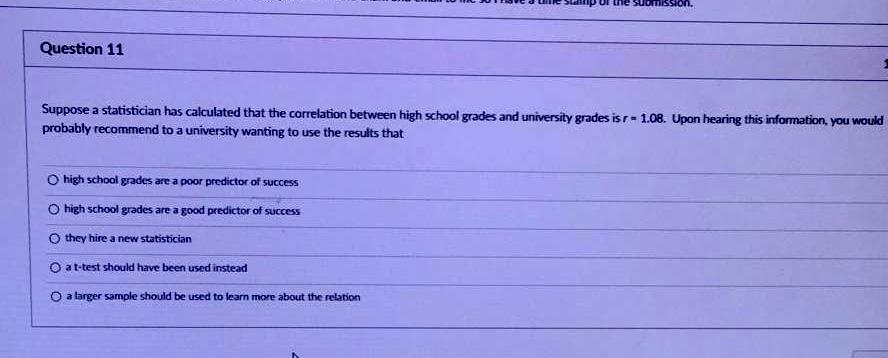
Question 11
Suppose a statistician has calculated that the correlation between high school grades and university grades is r- 1.08. Upon hearing this information, you would
probably recommend to a university wanting to use the results that
O high school grades are a poor predictor of success
O high school grades are a good predictor of success
O they hire a new statistician
O at-test should have been used instead
O a larger sample should be used to learn more about the relation
Expert Solution
This question has been solved!
Explore an expertly crafted, step-by-step solution for a thorough understanding of key concepts.

This is a popular solution

Trending nowThis is a popular solution!

Step by stepSolved in 2 steps

Knowledge Booster


Learn more about
Need a deep-dive on the concept behind this application? Look no further. Learn more about this topic, statistics and related others by exploring similar questions and additional content below.Similar questions
- Question 10 Suppose you will perform a test to determine whether there is sufficient evidence to support a claim of a linear correlation between two variables. Find the critical values of r given the number of pairs of data n and the significance level a. n = 9, a = 0.01 Or= 0.798 r= 0.834 r= +0.666 r= +0.798arrow_forwardHelp with 11arrow_forwardA Pearson correlation of r = -0.90 indicates that the data points are clustered close to a line that slopes down to the right. Question 3 options: True Falsearrow_forward
- 2. Please reference attachmentarrow_forward3. ACT scores are roughly Normal with mean 20.8 and standard deviation 4.8, and SAT scores are roughly Normal with mean 1026 and standard deviation 209. Some students take both. For those students, the correlation between the two scores is 0.72. a. What's the equation of the straight line that you'd use to predict ACT scores based on SAT scores? b. I got a 1300 on the SAT, and I'm planning to take the ACT. Predict what I might get, c. What's the equation of the straight line that you'd use to predict SAT scores based on ACT scores? d. My friend got a 27 on the ACT, and she's planning to take the SAT. Predict what she might get. e. How come you're predicting both that I'll do worse than her on the ACT and that she will do worse than me on the SAT? 4. Draw a simple random nlc of size 15 from the labels 40os01, 402.arrow_forward3.If the r value = .913, how do you classify it? Group of answer choices Weak Negative Correlation Strong Negative Correlation Weak Positive Correlation Strong Positive Correlationarrow_forward
- 16. In comparing the relationship between rainfall and hot dog sales, a student finds the correlation to be r = -0.56. What is the best description of the relationship between these two sets of data? Group of answer choices Negative and Strong Positive and Weak Negative and Moderate Positive and Moderatearrow_forwardPlease help, this is for financial mathematics, thank you so much!!!arrow_forward
arrow_back_ios
arrow_forward_ios
Recommended textbooks for you
- MATLAB: An Introduction with ApplicationsStatisticsISBN:9781119256830Author:Amos GilatPublisher:John Wiley & Sons Inc
 Probability and Statistics for Engineering and th...StatisticsISBN:9781305251809Author:Jay L. DevorePublisher:Cengage Learning
 Statistics for The Behavioral Sciences (MindTap C...StatisticsISBN:9781305504912Author:Frederick J Gravetter, Larry B. WallnauPublisher:Cengage Learning
  Elementary Statistics: Picturing the World (7th E...StatisticsISBN:9780134683416Author:Ron Larson, Betsy FarberPublisher:PEARSON
 The Basic Practice of StatisticsStatisticsISBN:9781319042578Author:David S. Moore, William I. Notz, Michael A. FlignerPublisher:W. H. Freeman
 Introduction to the Practice of StatisticsStatisticsISBN:9781319013387Author:David S. Moore, George P. McCabe, Bruce A. CraigPublisher:W. H. Freeman
MATLAB: An Introduction with Applications
Statistics
ISBN:9781119256830
Author:Amos Gilat
Publisher:John Wiley & Sons Inc
Probability and Statistics for Engineering and th...
Statistics
ISBN:9781305251809
Author:Jay L. Devore
Publisher:Cengage Learning
Statistics for The Behavioral Sciences (MindTap C...
Statistics
ISBN:9781305504912
Author:Frederick J Gravetter, Larry B. Wallnau
Publisher:Cengage Learning
Elementary Statistics: Picturing the World (7th E...
Statistics
ISBN:9780134683416
Author:Ron Larson, Betsy Farber
Publisher:PEARSON
The Basic Practice of Statistics
Statistics
ISBN:9781319042578
Author:David S. Moore, William I. Notz, Michael A. Fligner
Publisher:W. H. Freeman
Introduction to the Practice of Statistics
Statistics
ISBN:9781319013387
Author:David S. Moore, George P. McCabe, Bruce A. Craig
Publisher:W. H. Freeman