MATLAB: An Introduction with Applications
6th Edition
ISBN: 9781119256830
Author: Amos Gilat
Publisher: John Wiley & Sons Inc
expand_more
expand_more
format_list_bulleted
Question

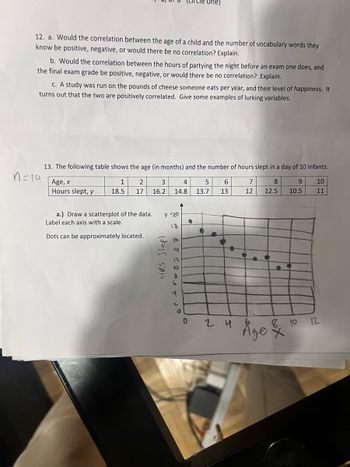
Transcribed Image Text:12. a. Would the correlation between the age of a child and the number of vocabulary words they
know be positive, negative, or would there be no correlation? Explain.
b. Would the correlation between the hours of partying the night before an exam one does, and
the final exam grade be positive, negative, or would there be no correlation? Explain.
c. A study was run on the pounds of cheese someone eats per year, and their level of happiness. It
turns out that the two are positively correlated. Give some examples of lurking variables.
n=10
13. The following table shows the age (in months) and the number of hours slept in a day of 10 infants.
Age, x
8
9
10
1 2
18.5 17
Hours slept, y
12.5
10.5 11
3 4 5 6
16.2 14.8 13.7 13
a.) Draw a scatterplot of the data. y 20
Label each axis with a scale.
18
Dots can be approximately located.
HRS Slept
1/6
ه دوره 2 - 2
0
●
24
7
12
Age
xx
10 12

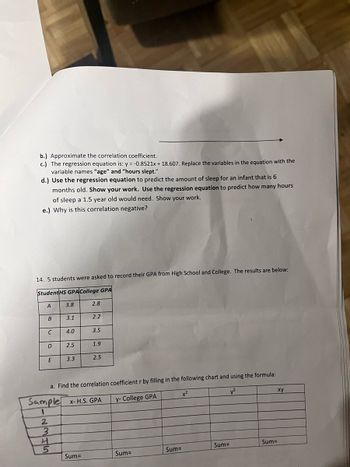
Transcribed Image Text:b.) Approximate the correlation coefficient.
c.) The regression equation is: y = -0.8521x + 18.607. Replace the variables in the equation with the
variable names "age" and "hours slept."
d.) Use the regression equation to predict the amount of sleep for an infant that is 6
months old. Show your work. Use the regression equation to predict how many hours
of sleep a 1.5 year old would need. Show your work.
e.) Why is this correlation negative?
14. 5 students were asked to record their GPA from High School and College. The results are below:
Student HS GPA College GPA
3.8
A
B
C
D
E
2
3
3.1
4
5
4.0
2.5
3.3
2.8
2.2
Sample x-H.S. GPA y- College GPA
1
Sum=
3.5
1.9
2.5
a. Find the correlation coefficient r by filling in the following chart and using the formula:
y²
Sum=
Sum=
x²
Sum=
Sum=
xy
Expert Solution
This question has been solved!
Explore an expertly crafted, step-by-step solution for a thorough understanding of key concepts.
This is a popular solution
Trending nowThis is a popular solution!
Step by stepSolved in 3 steps with 1 images

Knowledge Booster
Similar questions
- The data in the accompanying table represent the length of life, in years, measured to the nearest tenth, of 30 similar fuel pumps. Complete parts (a) through (c) below. Click the icon to view the fuel pump data. (a) Construct a stem-and-leaf plot for the life in years of the fuel pumps, using the digit to the left of the decimal point as the stem for each observation. Stem Leaf Frequency Get more help. Fuel Pump Life Spans 2.4 3.3 0.4 3.1 1.3 0.2 0.5 5.6 5.9 6.2 0.5 2.4 1.4 4.3 6.3 1.7 4.9 0.2 4.6 0.4 1.5 0.5 2.3 4.8 1.0 5.6 5.9 6.0 1.2 0.2 Print Done -X eck answarrow_forwardThe data represents the heights of eruptions by a geyser. Use the heights to construct a stemplot. Identify the two values that are closest to the middle when the data are sorted in order from lowest to highest. Height of eruption (in.) 65 31 50 90 80 50 40 70 67 73 52 50 54 68 63 60 Which plot represents a stemplot of the data? OA. 3 4023578 50037 6008 70034 80 90 B. 31 4 03 5 00024 603578 70037 808 90 Identify the two values that are closest to the middle when the data are sorted in order from lowest to highest. The values closest to the middle are ☐ inches and ☐ inches. (Type whole numbers. Use ascending order.) C. 3 034 4 025 5 007 6003 7 008 8 037 9 08 77 70 43 88arrow_forwardX Frequency 12 a. Construct a histogram for the data with 7 bars 2 1 3 3 4 14 5 15 b. Describe the shape of your histogram c. What does the histogram show us? 7 10 8 5arrow_forward
- The table below shows the number of state-registered automatic weapons and the murder rate for several Northwestern states. 11.8 8.2 6.9 3.6 2.5 2.8 2.6 0.4 14 11.3 10.2 7.4 6.5 6.3 5.9 4.5 x thousands of automatic weapons y = murders per 100,000 residents This data can be modeled by the equationý = 0.85x + 4.12. Use this equation to answer the following; %D A) How many murders per 100,000 residents can be expected in a state with 7.3 thousand automatic weapons? Answer = Nearest whole value. B) How many murders per 100,000 residents can be expected in a state with 1 thousand automatic weapons? Nearest whole value Answer =arrow_forwardUsing the following stem & leaf plot, find the five number summary for the data. View in full window so that you have 6 rows of data. 1 02 2 m 34459 4 2279 5 0 4 5 6 8 9 6 08 Min = Q₁² Med = Q3 Max = ▬▬▬▬arrow_forwardConsider the women's 100-yd dash (and the subsequent 100-m dash) in the Olympics since records have been kept. Determine the best way to combine all data and depict the data. Choose the correct answer below. O A. A line graph would be the best way to show all of the data over time, but some measurements would have to be converted to display the 100-yd and 100-m on the same graph. OB. A scatterplot would show the relationship between the 100-yd dash and the 100-m dash. O C. A stem and leaf plot would be the best way to show all of the data grouped by race times. O D. A histogram would show all of the data by comparing each year. The units of distance would not matter. Click to select your answer. 2:50 PM P Type here to search 3/10/202 Prt Scn End F10 PgUp Home F7 DII B F5 F6arrow_forward
- The two data sets are dependent. Find d¯¯¯d¯ to the nearest tenth. x 8.8 5.4 5.6 8.2 6.6 5.3 y 9.6 8.4 8.2 8.7 8.9 9.4 Round your answer to one decimal.arrow_forwardBigger snakes weigh more. Here is data comparing the length in centimeters to weight in grams of a certain species of snake. Use your Ti-84 to create a scatter plot, then match your graph to the correct scatter plot. Length 80 32 61 19 25 45 46 76 Weight 211 65 75 20 80 125 65 150arrow_forward
arrow_back_ios
arrow_forward_ios
Recommended textbooks for you
 MATLAB: An Introduction with ApplicationsStatisticsISBN:9781119256830Author:Amos GilatPublisher:John Wiley & Sons Inc
 Probability and Statistics for Engineering and th...StatisticsISBN:9781305251809Author:Jay L. DevorePublisher:Cengage Learning
 Statistics for The Behavioral Sciences (MindTap C...StatisticsISBN:9781305504912Author:Frederick J Gravetter, Larry B. WallnauPublisher:Cengage Learning
 Elementary Statistics: Picturing the World (7th E...StatisticsISBN:9780134683416Author:Ron Larson, Betsy FarberPublisher:PEARSON
 The Basic Practice of StatisticsStatisticsISBN:9781319042578Author:David S. Moore, William I. Notz, Michael A. FlignerPublisher:W. H. Freeman
 Introduction to the Practice of StatisticsStatisticsISBN:9781319013387Author:David S. Moore, George P. McCabe, Bruce A. CraigPublisher:W. H. Freeman

MATLAB: An Introduction with Applications
Statistics
ISBN:9781119256830
Author:Amos Gilat
Publisher:John Wiley & Sons Inc

Probability and Statistics for Engineering and th...
Statistics
ISBN:9781305251809
Author:Jay L. Devore
Publisher:Cengage Learning

Statistics for The Behavioral Sciences (MindTap C...
Statistics
ISBN:9781305504912
Author:Frederick J Gravetter, Larry B. Wallnau
Publisher:Cengage Learning

Elementary Statistics: Picturing the World (7th E...
Statistics
ISBN:9780134683416
Author:Ron Larson, Betsy Farber
Publisher:PEARSON

The Basic Practice of Statistics
Statistics
ISBN:9781319042578
Author:David S. Moore, William I. Notz, Michael A. Fligner
Publisher:W. H. Freeman

Introduction to the Practice of Statistics
Statistics
ISBN:9781319013387
Author:David S. Moore, George P. McCabe, Bruce A. Craig
Publisher:W. H. Freeman