
MATLAB: An Introduction with Applications
6th Edition
ISBN: 9781119256830
Author: Amos Gilat
Publisher: John Wiley & Sons Inc
expand_more
expand_more
format_list_bulleted
Related questions
Question
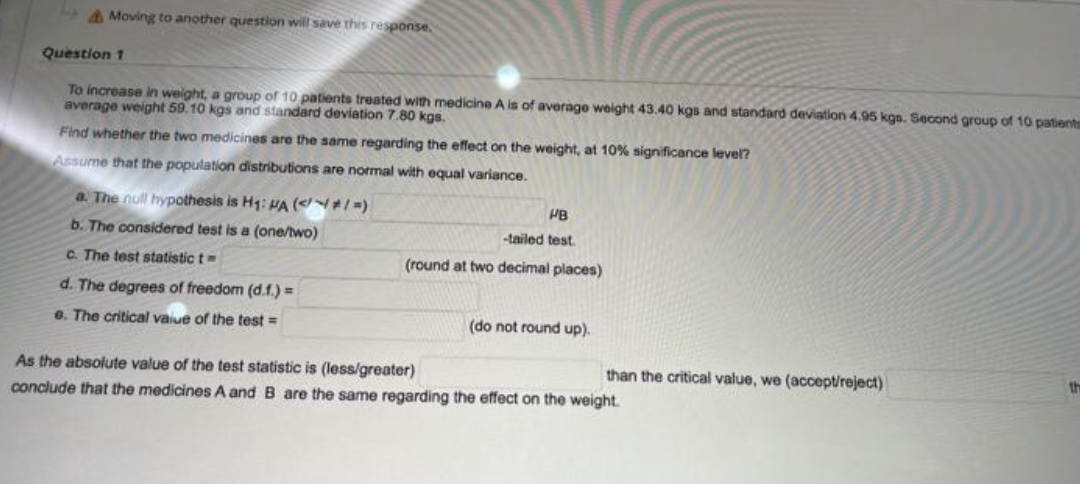

Transcribed Image Text:Moving to another question will save this response.
Question 1
To increase in weight, a group of 10 patients treated with medicine A is of average weight 43.40 kgs and standard deviation 4.95 kgs. Second group of 10 patients
average weight 59.10 kgs and standard deviation 7.80 kgs.
Find whether the two medicines are the same regarding the effect on the weight, at 10% significance level?
Assume that the population distributions are normal with equal variance.
a. The null hypothesis is H₁: HA (</#/=)
HB
b. The considered test is a (one/two)
-tailed test.
c. The test statistic t-
(round at two decimal places)
d. The degrees of freedom (d.f.) =
e. The critical value of the test =
(do not round up).
th
As the absolute value of the test statistic is (less/greater)
than the critical value, we (accept/reject)
conclude that the medicines A and B are the same regarding the effect on the weight.
Expert Solution
This question has been solved!
Explore an expertly crafted, step-by-step solution for a thorough understanding of key concepts.

Step by stepSolved in 4 steps

Knowledge Booster

Similar questions
- If a variable has a very small standard deviation, and the outcomes of the variable will... a. Also be associated with a very small mean since standardizing means the same b. In support of the alternative hypothesis since the small P value signal change c. Be from a standard normal curve d. Tightly clustered around the mean rather than be more spread outarrow_forwardA manufacturer of chocolate chips would like to know whether its bag filling machine works correctly at the 427 gram setting. It is believed that the machine is underfilling the bags. A 24 bag sample had a mean of 425 grams with a variance of 100. A level of significance of 0.01 will be used. Assume the population distribution is approximately normal. State the null and alternative hypotheses.arrow_forwardA therapist would like to evaluate an intervention for treating depression. A sample of n = 20 depressed clients is obtained, and each person’s level of depression is measured using a standardized questionnaire before they begin the therapy program. Two weeks after therapy, each client’s level of depression is measured again. The average level of depression dropped by 4.0 points following therapy. The difference scores had a variance of 64. Identify and Cclculate the appropriate test statistic.Make sure to report the degrees of freedom for the statistical test (if appropriate). You must show your work to receive full credit. State your conclusions (use a two-tailed test with a = .05 for all tests). Compute an effect size.arrow_forward
- Data on the weights (lb) of the contents of cans of diet soda versus the contents of cans of the regular version of the soda is summarized to the right. Assume that the two samples are independent simple random samples selected from normally distributed populations, and do not assume that the population standard deviations are equal. Complete parts (a) and (b) below. Use a 0.05 significance level for both parts. Diet Regular μ μ1 μ2 n 34 34 x 0.79146 lb 0.81544 lb s 0.00437 lb 0.00752 lb A. Test the claim that the contents of cans of diet soda have weights with a mean that is less than the mean for the regular soda. What are the null and alternative hypotheses? A. H0: μ1≠μ2 H1: μ1<μ2 B. H0: μ1=μ2 H1: μ1<μ2 C. H0: μ1=μ2 H1: μ1>μ2 D. H0: μ1=μ2 H1: μ1≠ The test statistic, t, is ______.(Round to two decimal places as needed.) B. Construct a confidence interval…arrow_forwardIf a treatment is expected to decrease scores on a variable for which the mean is expected to be µ = 50, what is the null hypothesis?arrow_forwardData on the weights (lb) of the contents of cans of diet soda versus the contents of cans of the regular version of the soda is summarized to the right. Assume that the two samples are independent simple random samples selected from normally distributed populations, and do not assume that the population standard deviations are equal. Complete parts (a) and (b) below. Use a 0.05 significance level for both parts. Diet Regular μ μ1 μ2 n 28 28 x 0.79741 lb 0.81023 lb s 0.00442 lb 0.00749 lb a. Test the claim that the contents of cans of diet soda have weights with a mean that is less than the mean for the regular soda. What are the null and alternative hypotheses? A. H0: μ1=μ2 H1: μ1≠μ2 B. H0: μ1≠μ2 H1: μ1<μ2 C. H0: μ1=μ2 H1: μ1>μ2 D. H0: μ1=μ2 H1: μ1<μ2 The test statistic, t, is nothing. (Round to two decimal places as needed.) The P-value is nothing.…arrow_forward
- A study was conducted to determine whether magnets were effective in treating pain. The values represent measurements of pain using the visual analog scale. Assume that both samples are independent simple random samples from populations having normal distributions. Use a 0.05 significance level to test the claim that those given a sham treatment have pain reductions that vary more than the pain reductions for those treated with magnets. What are the null and alternative hypotheses? OA. Ho: 002 H₁:0² = 0²/2 OC. H₂:0²=0²2 H₁:0² > 0²/2 Identify the test statistic. F = (Round to two decimal places as needed.) Use technology to identify the P-value. The P-value is (Round to three decimal places as needed.) What is the conclusion for this hypothesis test? C OB. H₁: 0 = 0² H₁:0² +03 OD. H₂:0²=0²2 H₁:0² <0²/ O A. Reject Ho. There is sufficient evidence to support the claim that those given a sham treatment have pain reductions that vary more than those treated with magnets. O B. Fail to reject…arrow_forwardTwo samples. each with n = 5 scores, have a pooled variance of 40. What is the estimated standard error for the sample mean uniference? how do i solve?arrow_forwardTwo samples, each with n = 5 scores, have a pooled variance of s 2 p = 40. What is the estimated standard error for the sample mean difference? a. s(M1 - M2) = 10 b. s(M1 - M2) = 20 c. s(M1 - M2) = 4 d. s(M1 - M2) = 8arrow_forward
- The results of a state mathematics test for random samples of students taught by two different teachers at the same school are shown below. Can you conclude there is a difference in the mean mathematics test scores for the students of the two teachers? Use α = 0.01. In addition, assume the populations are normally distributed and the population variances/standard deviations are not equal. Teacher 1 Teacher 2 ?̅1 = 473 ?̅2 = 459 S1 = 39.7 S2 = 24.5 n 1 = 8 n 2 = 18 a. State the null and alternate hypotheses (write it mathematically) and write your claim. b. Find the test statistic c. Identify the Rejection region (critical region) and fail to reject region. Show this by drawing a curve and…arrow_forwardA new study has found that, on average, 6- to 12-year-old children are spending less time on household chores today compared to 1981 levels. Suppose two samples representative of the study's results report the following summary statistics for the two periods. 1981 Levels 2008 Levels 24 minutes 19 minutes 51 = 3.5 minutes 52 - 4.3 minutes ni = 30 n2 - 30 Which of the following is the correct value of the test statistic assuming that the unknown population variances are equal? Multiple Cholce Z = -4.94 tss = 4.94 Z = 4.94 t59 = -4.94arrow_forwardData on the weights (lb) of the contents of cans of diet soda versus the contents of cans of the regular version of the soda is summarized to the right. Assume that the two samples are independent simple random samples selected from normally distributed populations, and do not assume that the population standard deviations are equal. Complete parts (a) and (b) below. Use a 0.01 significance level for both parts. a. Test the claim that the contents of cans of diet soda have weights with a mean that is less than the mean for the regular soda. What are the null and alternative hypotheses? OA. Ho: H₁ H₂ H₁: Hy #4₂ OC, Hoi ky tuy H₁: Hy O L P H command n X S Time Remaining: 01:13:11 V : • Diet H₁ 30 0.79861 lb 0.00445 lb ; x { [ option ? I Regular H₂ 30 0.80936 lb 0.00742 lb Next deletearrow_forward
arrow_back_ios
SEE MORE QUESTIONS
arrow_forward_ios
Recommended textbooks for you
- MATLAB: An Introduction with ApplicationsStatisticsISBN:9781119256830Author:Amos GilatPublisher:John Wiley & Sons Inc
 Probability and Statistics for Engineering and th...StatisticsISBN:9781305251809Author:Jay L. DevorePublisher:Cengage Learning
 Statistics for The Behavioral Sciences (MindTap C...StatisticsISBN:9781305504912Author:Frederick J Gravetter, Larry B. WallnauPublisher:Cengage Learning
  Elementary Statistics: Picturing the World (7th E...StatisticsISBN:9780134683416Author:Ron Larson, Betsy FarberPublisher:PEARSON
 The Basic Practice of StatisticsStatisticsISBN:9781319042578Author:David S. Moore, William I. Notz, Michael A. FlignerPublisher:W. H. Freeman
 Introduction to the Practice of StatisticsStatisticsISBN:9781319013387Author:David S. Moore, George P. McCabe, Bruce A. CraigPublisher:W. H. Freeman
MATLAB: An Introduction with Applications
Statistics
ISBN:9781119256830
Author:Amos Gilat
Publisher:John Wiley & Sons Inc
Probability and Statistics for Engineering and th...
Statistics
ISBN:9781305251809
Author:Jay L. Devore
Publisher:Cengage Learning
Statistics for The Behavioral Sciences (MindTap C...
Statistics
ISBN:9781305504912
Author:Frederick J Gravetter, Larry B. Wallnau
Publisher:Cengage Learning
Elementary Statistics: Picturing the World (7th E...
Statistics
ISBN:9780134683416
Author:Ron Larson, Betsy Farber
Publisher:PEARSON
The Basic Practice of Statistics
Statistics
ISBN:9781319042578
Author:David S. Moore, William I. Notz, Michael A. Fligner
Publisher:W. H. Freeman
Introduction to the Practice of Statistics
Statistics
ISBN:9781319013387
Author:David S. Moore, George P. McCabe, Bruce A. Craig
Publisher:W. H. Freeman