
MATLAB: An Introduction with Applications
6th Edition
ISBN: 9781119256830
Author: Amos Gilat
Publisher: John Wiley & Sons Inc
expand_more
expand_more
format_list_bulleted
Related questions
Question
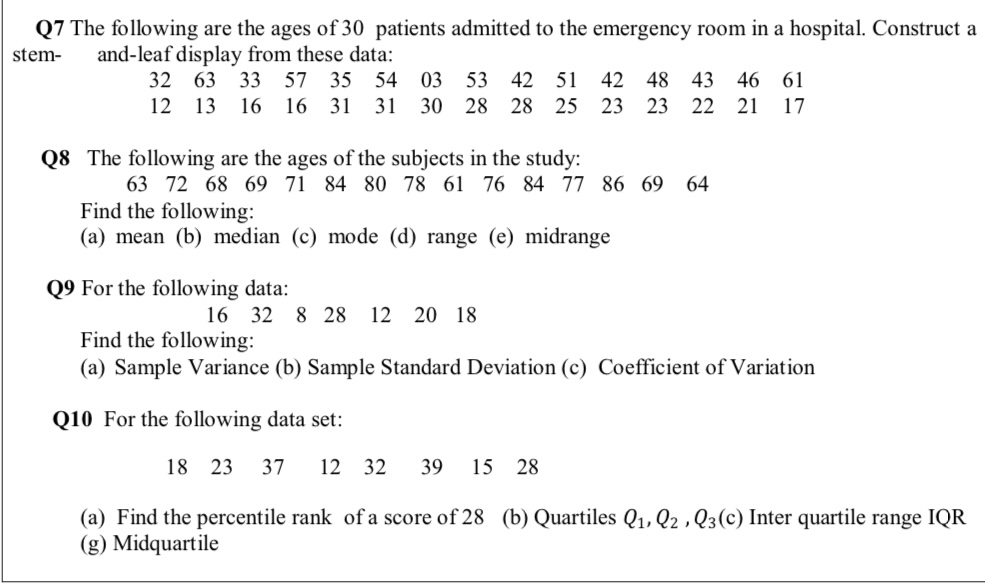

Transcribed Image Text:Q7 The following are the ages of 30 patients admitted to the emergency room in a hospital. Construct a
and-leaf display from these data:
57 35 54
03
stem-
32 63 33
53 42 51
42
48 43
46 61
12 13 16
16 31
31
30 28 28 25
23
23 22 21
17
Q8 The following are the ages of the subjects in the study:
63 72 68 69 71 84 80 78 61 76 84 77 86 69 64
Find the following:
(a) mean (b) median (c) mode (d) range (e) midrange
Q9 For the following data:
16 32 8 28
12 20 18
Find the following:
(a) Sample Variance (b) Sample Standard Deviation (c) Coefficient of Variation
Q10 For the following data set:
18 23
37
12 32
39
15 28
(a) Find the percentile rank of a score of 28 (b) Quartiles Q1, Q2 , Q3(c) Inter quartile range IQR
(g) Midquartile
Expert Solution
This question has been solved!
Explore an expertly crafted, step-by-step solution for a thorough understanding of key concepts.

This is a popular solution

Trending nowThis is a popular solution!

Step by stepSolved in 2 steps with 1 images

Knowledge Booster

Similar questions
- K A university conducted a survey of 387 undergraduate students regarding satisfaction with student government. Results of the survey are shown in the table by class rank. Complete parts (a) through (d) below. Click the icon to view the table. 美 Data table Satisfied Neutral Not satisfied Total Freshman Sophomore Junior Senior 51 48 62 59 28 20 18 13 23 21 18 26 102 89 98 98 Total D₁ 220 79 88 387arrow_forwardHere is a set of data. 75 90 108 266 391 469 560 690 694 725 798 803 857 964 Identify the 5 number summary (min, Q1, median, Q3, max)arrow_forwardHere is a set of data. 27 231 276 283 299 308 321 407 567 584 587 625 737 830 966 974 Identify the 5 number summary (min, Q1, median, Q3, max)arrow_forward
- Construct an ordered stem and leaf display for the following data. 91 104 90 109 118 89 116 127 107 98 100 96 92 114 95 122 Complete the ordered stem and leaf diagram below. 10 11 12arrow_forwardL1Q7.The following table shows the number of people who have different eye color and hair colors.arrow_forwardConsider the data. X; 2 6 9 13 20 Y; 9 2 10 25 22arrow_forward
arrow_back_ios
arrow_forward_ios
Recommended textbooks for you
- MATLAB: An Introduction with ApplicationsStatisticsISBN:9781119256830Author:Amos GilatPublisher:John Wiley & Sons Inc
 Probability and Statistics for Engineering and th...StatisticsISBN:9781305251809Author:Jay L. DevorePublisher:Cengage Learning
 Statistics for The Behavioral Sciences (MindTap C...StatisticsISBN:9781305504912Author:Frederick J Gravetter, Larry B. WallnauPublisher:Cengage Learning
  Elementary Statistics: Picturing the World (7th E...StatisticsISBN:9780134683416Author:Ron Larson, Betsy FarberPublisher:PEARSON
 The Basic Practice of StatisticsStatisticsISBN:9781319042578Author:David S. Moore, William I. Notz, Michael A. FlignerPublisher:W. H. Freeman
 Introduction to the Practice of StatisticsStatisticsISBN:9781319013387Author:David S. Moore, George P. McCabe, Bruce A. CraigPublisher:W. H. Freeman
MATLAB: An Introduction with Applications
Statistics
ISBN:9781119256830
Author:Amos Gilat
Publisher:John Wiley & Sons Inc
Probability and Statistics for Engineering and th...
Statistics
ISBN:9781305251809
Author:Jay L. Devore
Publisher:Cengage Learning
Statistics for The Behavioral Sciences (MindTap C...
Statistics
ISBN:9781305504912
Author:Frederick J Gravetter, Larry B. Wallnau
Publisher:Cengage Learning
Elementary Statistics: Picturing the World (7th E...
Statistics
ISBN:9780134683416
Author:Ron Larson, Betsy Farber
Publisher:PEARSON
The Basic Practice of Statistics
Statistics
ISBN:9781319042578
Author:David S. Moore, William I. Notz, Michael A. Fligner
Publisher:W. H. Freeman
Introduction to the Practice of Statistics
Statistics
ISBN:9781319013387
Author:David S. Moore, George P. McCabe, Bruce A. Craig
Publisher:W. H. Freeman