MATLAB: An Introduction with Applications
6th Edition
ISBN: 9781119256830
Author: Amos Gilat
Publisher: John Wiley & Sons Inc
expand_more
expand_more
format_list_bulleted
Question
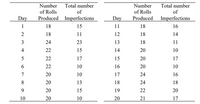
Q2) A paper mill uses a control chart to monitor the imperfection in finished rolls of paper. Production output is inspected for 20 days, and the resulting data are shown here. Use these data to set up a control chart for nonconformities per roll of paper.
(a) Does the process appear to be in statistical control? What center line and control limits would you recommend for controlling current production?
(b) Set up a u chart based on an average
(c) Set up a standardized u chart for this process.

Transcribed Image Text:Number Total number
Number
of Rolls
Total number
of Rolls
of
of
Day
Produced Imperfections
Day
Produced Imperfections
1
18
15
11
18
16
18
11
12
18
14
3
24
23
13
18
11
4
22
15
14
20
10
5
22
17
15
20
17
6.
22
10
16
20
10
7
20
10
17
24
16
8
20
13
18
24
18
20
15
19
22
20
10
20
10
20
21
17
2.
Expert Solution
This question has been solved!
Explore an expertly crafted, step-by-step solution for a thorough understanding of key concepts.
This is a popular solution
Trending nowThis is a popular solution!
Step by stepSolved in 3 steps with 2 images

Knowledge Booster
Learn more about
Need a deep-dive on the concept behind this application? Look no further. Learn more about this topic, statistics and related others by exploring similar questions and additional content below.Similar questions
- pare percentage differences between 2 or more categories of an independent variable), the following statistical test should be used: a. Simple linear regression b. Pearson correlation coefficient c. T test d. Chi-square testarrow_forwardExamine the normal quartile plot and determine whether it depicts sample data from a population with a normal distribution Does the normal quantile plot depict sample data from a population with a normal distribution? A. No. The points do not lie close to a straight lineB. Yes. The points are evenly distributed above and below the mean, 0C. The points exhibit some systematic pattern that is not a straight-line patternd. Yes. The pattern of the points is reasonable close to a straight line.arrow_forwardChoose the appropriate statistical test. When computing, be sure to round each answer as indicated. A dentist wonders if depression affects ratings of tooth pain. In the general population, using a scale of 1-10 with higher values indicating more pain, the average pain rating for patients with toothaches is 6.8. A sample of 30 patients that show high levels of depression have an average pain rating of 7.1 (variance 0.8). What should the dentist determine? 1. Calculate the estimated standard error. (round to 3 decimals). [st.error] 2. What is thet-obtained? (round to 3 decimals). 3. What is the t-cv? (exact value) 4. What is your conclusion? Only type "Reject" or Retain"arrow_forward
- Suppose we want to compare scores (which can take on any value within a specified range) at baseline and at follow-up for a given sample. Using the data in the table below, compute a 95% CI for the mean difference in scores. Subject ID Baseline Follow-Up 1 13 6 2 10 8 3 9 11 4 12 11 5 8 5arrow_forwardA. Determine the test statistic B. What are the critical values C. What is the p valuearrow_forwardA. What is the sample variance?B. What is the mode and kurtosis of the data C. In a box-and-whisker plot, what is the IQR?arrow_forward
- A method or a set of procedures of using sample data to estimate a population parameter is called A. statistical inference B. statistical interference C. statistical appliance D. statistical descriptionarrow_forwarda. (True or False) The weekly consumption of favorite beverages from this survey hasapproximately a normal distribution, explain your decision. b. Based on the histogram, which one is greater: mean or median? Explain why.c. Which summary statistic would be a better representation of the center for this sample:mean or median?arrow_forwardThe article cited in Exercise 19 provides measures of electrical conductivity (in uS/cm). The results are presented in the following table. Sample Size 49 Location Mean SD Upstream 463 208 Midstream 363 98 31 Downstream 647 878 30 Can a one-way analysis of variance be used to determine whether conductivity varies with location? Or is one of the necessary assumptions violated? Explain.arrow_forward
arrow_back_ios
arrow_forward_ios
Recommended textbooks for you
 MATLAB: An Introduction with ApplicationsStatisticsISBN:9781119256830Author:Amos GilatPublisher:John Wiley & Sons Inc
 Probability and Statistics for Engineering and th...StatisticsISBN:9781305251809Author:Jay L. DevorePublisher:Cengage Learning
 Statistics for The Behavioral Sciences (MindTap C...StatisticsISBN:9781305504912Author:Frederick J Gravetter, Larry B. WallnauPublisher:Cengage Learning
 Elementary Statistics: Picturing the World (7th E...StatisticsISBN:9780134683416Author:Ron Larson, Betsy FarberPublisher:PEARSON
 The Basic Practice of StatisticsStatisticsISBN:9781319042578Author:David S. Moore, William I. Notz, Michael A. FlignerPublisher:W. H. Freeman
 Introduction to the Practice of StatisticsStatisticsISBN:9781319013387Author:David S. Moore, George P. McCabe, Bruce A. CraigPublisher:W. H. Freeman

MATLAB: An Introduction with Applications
Statistics
ISBN:9781119256830
Author:Amos Gilat
Publisher:John Wiley & Sons Inc

Probability and Statistics for Engineering and th...
Statistics
ISBN:9781305251809
Author:Jay L. Devore
Publisher:Cengage Learning

Statistics for The Behavioral Sciences (MindTap C...
Statistics
ISBN:9781305504912
Author:Frederick J Gravetter, Larry B. Wallnau
Publisher:Cengage Learning

Elementary Statistics: Picturing the World (7th E...
Statistics
ISBN:9780134683416
Author:Ron Larson, Betsy Farber
Publisher:PEARSON

The Basic Practice of Statistics
Statistics
ISBN:9781319042578
Author:David S. Moore, William I. Notz, Michael A. Fligner
Publisher:W. H. Freeman

Introduction to the Practice of Statistics
Statistics
ISBN:9781319013387
Author:David S. Moore, George P. McCabe, Bruce A. Craig
Publisher:W. H. Freeman