
MATLAB: An Introduction with Applications
6th Edition
ISBN: 9781119256830
Author: Amos Gilat
Publisher: John Wiley & Sons Inc
expand_more
expand_more
format_list_bulleted
Related questions
Question
thumb_up100%
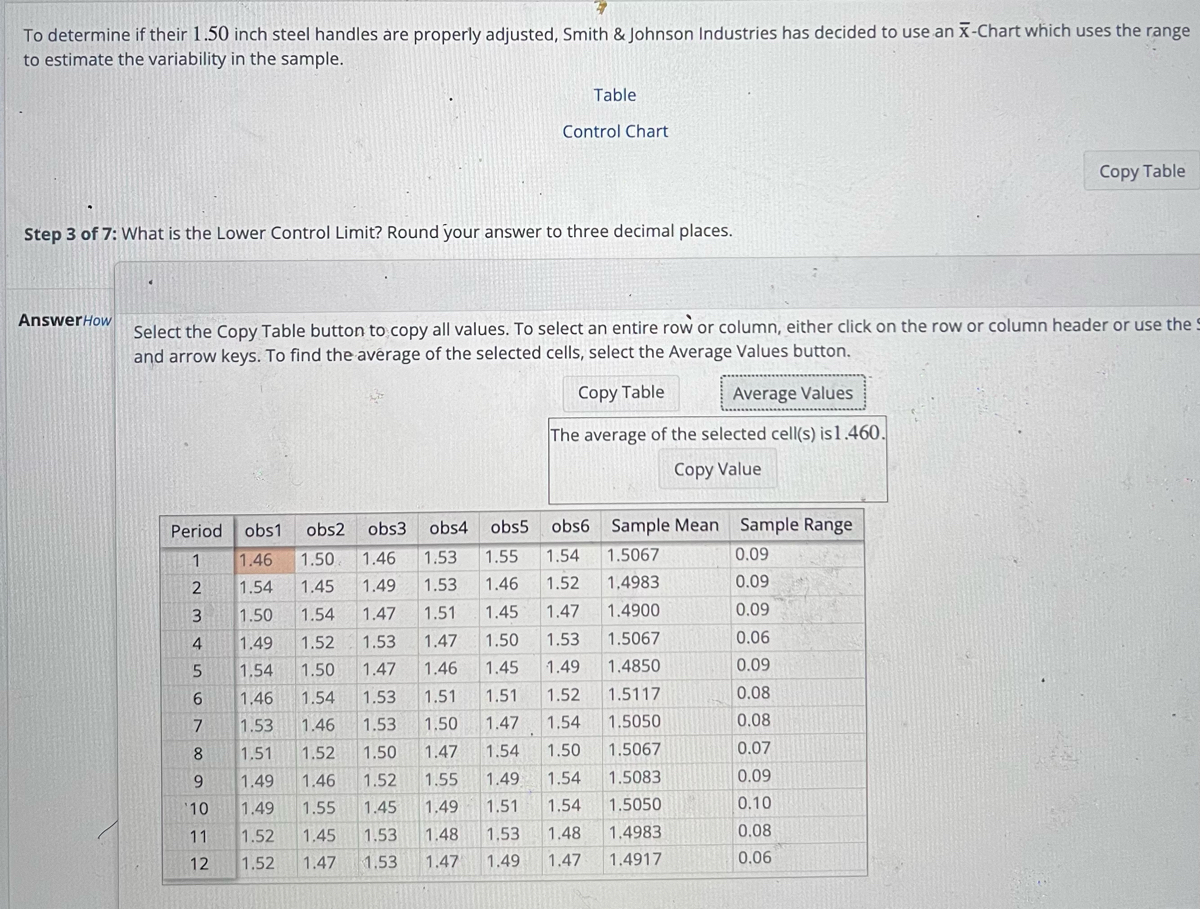

Transcribed Image Text:To determine if their 1.50 inch steel handles are properly adjusted, Smith & Johnson Industries has decided to use an X-Chart which uses the range
to estimate the variability in the sample.
AnswerHow
Step 3 of 7: What is the Lower Control Limit? Round your answer to three decimal places.
Period obs1 obs2 obs3 obs4 obs5
1 1.46 1.50 1.46 1.53 1.55
1.54 1.45
1.50 1.54
1.52
1.49 1.53
1.47 1.51
1.47
1.49
1.53
5 1.54 1.50
1.47
1.46 1.54
1.53 1.46
1.51 1.52
1.49 1.46
1.55
1.45
1.47
1.53
1.53
1.50
1.52
1.45 1.49
1.53 1.48
1.53 1.47 1.49
JAWN -
Select the Copy Table button to copy all values. To select an entire row or column, either click on the row or column header or use the S
and arrow keys. To find the average of the selected cells, select the Average Values button.
Copy Table
Average Values
The average of the selected cell(s) is 1.460.
Copy Value
2
3
4
6789 22
10 1.49
11 1.52
1.52
O Control Chart
12
Table
obs6
1.54
1.46 1.52
1.47
1.45
1.50 1.53
1.46 1.45 1.49
1.51 1.52
1.51
1.50 1.47 1.54
1.47 1.54 1.50
1.55 1.49 1.54
1.51 1.54
1.53 1.48
1.47
Sample Mean Sample Range
1.5067
1.4983
1.4900
1.5067
1.4850
1.5117
1.5050
1.5067
1.5083
1.5050
1.4983
1.4917
0.09
0.09
0.09
0.06
0.09
Copy Table
0.08
0.08
0.07
0.09
0.10
0.08
0.06
Expert Solution
This question has been solved!
Explore an expertly crafted, step-by-step solution for a thorough understanding of key concepts.

Step by stepSolved in 3 steps with 5 images

Knowledge Booster

Similar questions
- Ten percent of students at ACM are nursing students. Forty percent of students at ACM are sophomores. Five percent of ACM sophomores are nursing students. Assume that ACM only has freshman and sophomore students. What percent of ACM nursing students are freshman? Type your answer as a decimal rounded to the nearest hundredth (two decimal places).arrow_forwardIf you receive a 5% pay raise and then a 5% pay cut is your salary the same? Why or why not? Demonstrate your answer using actual valuesarrow_forwardIn 2015, alcohol used among high school seniors was down from the previous year by 5.6% to 35.5%. What was the usage rate for the previous year (2014)?arrow_forward
- In your English class, essays are 40% of your grade, homework is 20% of your grade, attendance is 5% of your grade, and the final project is 35% of your grade. At the end of the semester, your essay average is 88, your homework average is 92, and your attendance average is 91. What score do you need on the final project to get an A- (90%) in the class? (Round your answer to 2 decimal places.)arrow_forwardA researcher studied the relationship between family income and the amount of moneyspent on an auto mobile. She calculated that r2 = 45%. WHich is th correct interpretation?arrow_forwardMike’s class is building a model of the new One World Trade Center (OWTC) in New York City. They used a scale of 0.005 for their model; that is, each measure of the actual building is multiplied by 0.005 to find the measure of the corresponding part on the model. If the height of the OWTC is 1776 ft, what is the height of the model?arrow_forward
- A company manages an electronic equipment store and has ordered 200 LCD TVs for a special sale. The list price for each TV is $230 with a trade discount series of 5/9/3 Find the net price of the order by using the net decimal equivalent.arrow_forwardWhat is the overall percent increase (or decrease) after all three of the following changes are applied to a starting amount of $100? (1) A percent increase of 20%; (2) A percent decrease of 40% and; (3) A percent increase of 10%? Round to the nearest tenth of a percent. State whether it is a percent increase or a percent decrease.Show your work.arrow_forwardSimplify your answer as much as possiblearrow_forward
- Calculate the GPA of a student with the following grades: A (15 hours), C (10 hours), F (6 hours). Note that an A is equivalent to 4.0, a B is equivalent to a 3.0, a C is equivalent to a 2.0, a D is equivalent to a 1.0, and an F is equivalent to a 0. Round your answer to two decimal places. Takla Kounadarrow_forwardi have 12 cupcakes 3/4 were sold how many are leftarrow_forwardFor women in a recent triathlon, the average finishing time was 5261 seconds with an SD of 807 seconds. Find the cutoff time (in seconds) for the fastest 5% of women running the triathlon. Round your answer to two decimal places.arrow_forward
arrow_back_ios
SEE MORE QUESTIONS
arrow_forward_ios
Recommended textbooks for you
- MATLAB: An Introduction with ApplicationsStatisticsISBN:9781119256830Author:Amos GilatPublisher:John Wiley & Sons Inc
 Probability and Statistics for Engineering and th...StatisticsISBN:9781305251809Author:Jay L. DevorePublisher:Cengage Learning
 Statistics for The Behavioral Sciences (MindTap C...StatisticsISBN:9781305504912Author:Frederick J Gravetter, Larry B. WallnauPublisher:Cengage Learning
  Elementary Statistics: Picturing the World (7th E...StatisticsISBN:9780134683416Author:Ron Larson, Betsy FarberPublisher:PEARSON
 The Basic Practice of StatisticsStatisticsISBN:9781319042578Author:David S. Moore, William I. Notz, Michael A. FlignerPublisher:W. H. Freeman
 Introduction to the Practice of StatisticsStatisticsISBN:9781319013387Author:David S. Moore, George P. McCabe, Bruce A. CraigPublisher:W. H. Freeman
MATLAB: An Introduction with Applications
Statistics
ISBN:9781119256830
Author:Amos Gilat
Publisher:John Wiley & Sons Inc
Probability and Statistics for Engineering and th...
Statistics
ISBN:9781305251809
Author:Jay L. Devore
Publisher:Cengage Learning
Statistics for The Behavioral Sciences (MindTap C...
Statistics
ISBN:9781305504912
Author:Frederick J Gravetter, Larry B. Wallnau
Publisher:Cengage Learning
Elementary Statistics: Picturing the World (7th E...
Statistics
ISBN:9780134683416
Author:Ron Larson, Betsy Farber
Publisher:PEARSON
The Basic Practice of Statistics
Statistics
ISBN:9781319042578
Author:David S. Moore, William I. Notz, Michael A. Fligner
Publisher:W. H. Freeman
Introduction to the Practice of Statistics
Statistics
ISBN:9781319013387
Author:David S. Moore, George P. McCabe, Bruce A. Craig
Publisher:W. H. Freeman