
MATLAB: An Introduction with Applications
6th Edition
ISBN: 9781119256830
Author: Amos Gilat
Publisher: John Wiley & Sons Inc
expand_more
expand_more
format_list_bulleted
Related questions
Question
- Calculate the value for (a) in the table above.
- Calculate p-bar based on the samples above.
- What is the UCL and LCL for a p chart based on the data provided and a desired control level of 99.74%?
- Use your control limits from part b along with the data provided to draw a p-chart.
- Is the process in control? Why or why not? If not in control, suggest some potential reasons.
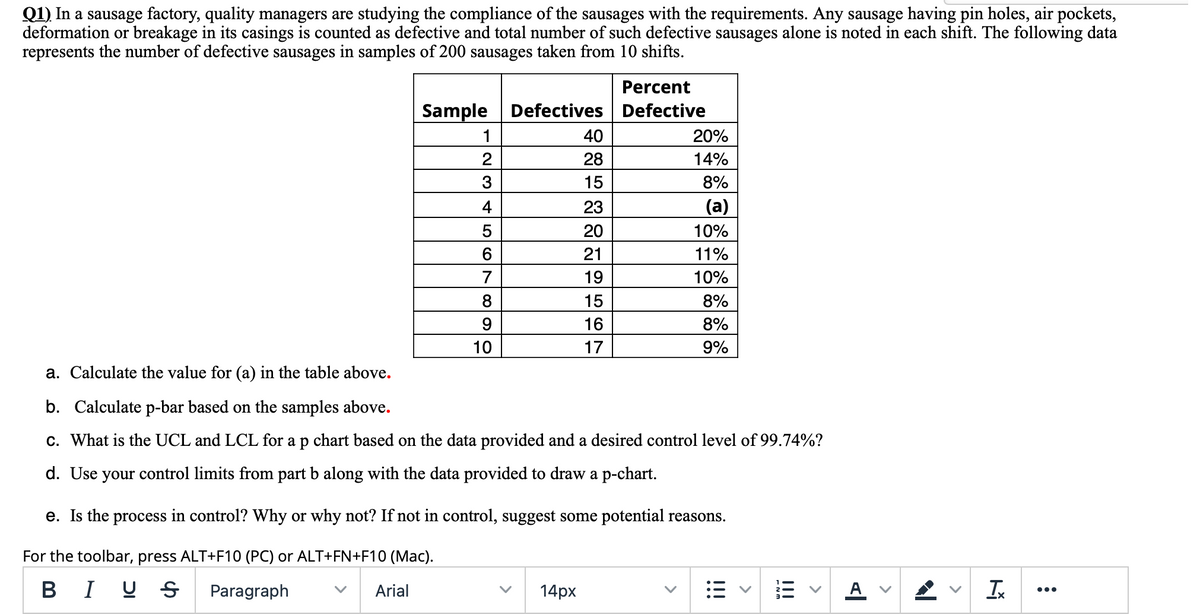

Transcribed Image Text:Q1) In a sausage factory, quality managers are studying the compliance of the sausages with the requirements. Any sausage having pin holes, air pockets,
deformation or breakage in its casings is counted as defective and total number of such defective sausages alone is noted in each shift. The following data
represents the number of defective sausages in samples of 200 sausages taken from 10 shifts.
Percent
Sample Defectives Defective
1
40
20%
2
28
14%
3
15
8%
4
23
(a)
20
10%
21
11%
7
19
10%
8
15
8%
9
16
8%
10
17
9%
a. Calculate the value for (a) in the table above.
b. Calculate p-bar based on the samples above.
c. What is the UCL and LCL for a p chart based on the data provided and a desired control level of 99.74%?
d. Use your control limits from part b along with the data provided to draw a p-chart.
e. Is the process in control? Why or why not? If not in control, suggest some potential reasons.
For the toolbar, press ALT+F10 (PC) or ALT+FN+F10 (Mac).
BI U S
Paragraph
Arial
14рх
三
A v
In
•..
>
>
II
Expert Solution
This question has been solved!
Explore an expertly crafted, step-by-step solution for a thorough understanding of key concepts.

This is a popular solution

Trending nowThis is a popular solution!

Step by stepSolved in 3 steps

Knowledge Booster


Learn more about
Need a deep-dive on the concept behind this application? Look no further. Learn more about this topic, statistics and related others by exploring similar questions and additional content below.Similar questions
- Claim: A Frosted Fruits cereal box contains more than 16 ounces of cereal. A random sample of 43 revealed a mean of 16.43 ounces. Use the p-value method at a 3% significance level to test the claim assuming a known population standard deviation of 2.08. Find the P-value, showing keystrokes used in ti-84.arrow_forwardOnly answer part C, use Part B and the chart if needed.arrow_forward3..arrow_forward
- Find the 5 number summary for the data shown 5.4 7 9.2 13.8 19.9 21.9 23.3 26.1 5 number summary: Use the Locator/Percentile method described in your book, not your calculator. Submit Question Earrow_forwardReview this chart. Identify what type of figure/chart is presented and briefly explain what each chart is reporting.arrow_forwardYou decide that you want to make sure your estimate from part a is correct. You go out and gather 10 simple random samples of 25 people in your school and calculate the proportion of students within each sample whose Amazon packages arrive within two business days of ordering. The proportion of customers that receive their packages within two days of ordering are given below. 0.70, 0.75, 0.6, 0.95, 0.90, 0.73, 0.87, 0.86, 0.92, 0.97 Explain why all of the sample proportions are not the same.arrow_forward
- How many observations are in the data set? How do I calculate this in the "R" program?arrow_forwardTo determine if their 1.50 inch steel handles are properly adjusted, Smith & Johnson Industries has decided to use an X-Chart which uses the range to estimate the variability in the sample. Step 1 of 7: What is the Center Line of the control chart? Round your answer to three decimal places. Table Period 1 2 Control Chart AnswerHow Select the Copy Table button to copy all values. To select an entire row or column, either click on the row or column header or use the Shi and arrow keys. To find the average of the selected cells, select the Average Values button. Copy Table 456789 Sample Mean Sample Range obs1 obs2 obs3 obs4 obs5 obs6 1.46 1.50 1.46 1.53 1.55 1.54 1.5067 1.54 1.45 1.49 1.4983 1.53 1.46 1.52 1.45 1.47 3 1.50 1.54 1.47 1.51 1.4900 1.53 1.47 1.50 1.53 1.5067 1.46 1.45 1.49 1.4850 1.51 1.5117 1.49 1.52 1.54 1.50 1.46 1.54 1.53 1.46 1.51 1.52 1.49 1.46 1.50 1.47 1.47 1.53 1.53 1.50 1.47 1.52 1.45 1.51 1.52 1.54 1.54 1.50 1.5050 1.5067 1.55 1.49 1.54 1.5083 1.51 1.54 1.5050 1.49…arrow_forwardN To determine if their 1.50 inch steel handles are properly adjusted, Smith & Johnson Industries has decided to use an X-Chart which uses the range to estimate the variability in the sample. Answe Step 2 of 7: What is the Upper Control Limit? Round your answer to three decimal places. Table 1 2 Control Chart Select the Copy Table button to copy all values. To select an entire row or column, either click on the row or column header or use the Shift and arrow keys. To find the average of the selected cells, select the Average Values button. Copy Table Average Values The average of the selected cell(s) is 1.460. Copy Value 34 Period obs1 obs2 obs3 obs4 obs5 obs6 Sample Mean Sample Range 1.46 1.50 1.46 1.53 1.55 1.54 1.5067 1.54 1.45 1.49 1.53 1.46 1.52 1.4983 1.50 1.54 1.47 1.51 1.45 1.47 1.4900 1.49 1.52 1.53 1.47 1.50 1.53 1.5067 5 1.46 1.45 1.49 1.4850 6 1.51 1.51 1.52 1.5117 7 1.53 1.50 1.47 1.54 1.5050 8 1.50 1.5067 1.54 1.50 1.47 1.46 1.54 1.53 1.53 1.46 1.51 1.52 1.50 1.47 1.54…arrow_forward
arrow_back_ios
arrow_forward_ios
Recommended textbooks for you
- MATLAB: An Introduction with ApplicationsStatisticsISBN:9781119256830Author:Amos GilatPublisher:John Wiley & Sons Inc
 Probability and Statistics for Engineering and th...StatisticsISBN:9781305251809Author:Jay L. DevorePublisher:Cengage Learning
 Statistics for The Behavioral Sciences (MindTap C...StatisticsISBN:9781305504912Author:Frederick J Gravetter, Larry B. WallnauPublisher:Cengage Learning
  Elementary Statistics: Picturing the World (7th E...StatisticsISBN:9780134683416Author:Ron Larson, Betsy FarberPublisher:PEARSON
 The Basic Practice of StatisticsStatisticsISBN:9781319042578Author:David S. Moore, William I. Notz, Michael A. FlignerPublisher:W. H. Freeman
 Introduction to the Practice of StatisticsStatisticsISBN:9781319013387Author:David S. Moore, George P. McCabe, Bruce A. CraigPublisher:W. H. Freeman
MATLAB: An Introduction with Applications
Statistics
ISBN:9781119256830
Author:Amos Gilat
Publisher:John Wiley & Sons Inc
Probability and Statistics for Engineering and th...
Statistics
ISBN:9781305251809
Author:Jay L. Devore
Publisher:Cengage Learning
Statistics for The Behavioral Sciences (MindTap C...
Statistics
ISBN:9781305504912
Author:Frederick J Gravetter, Larry B. Wallnau
Publisher:Cengage Learning
Elementary Statistics: Picturing the World (7th E...
Statistics
ISBN:9780134683416
Author:Ron Larson, Betsy Farber
Publisher:PEARSON
The Basic Practice of Statistics
Statistics
ISBN:9781319042578
Author:David S. Moore, William I. Notz, Michael A. Fligner
Publisher:W. H. Freeman
Introduction to the Practice of Statistics
Statistics
ISBN:9781319013387
Author:David S. Moore, George P. McCabe, Bruce A. Craig
Publisher:W. H. Freeman