
MATLAB: An Introduction with Applications
6th Edition
ISBN: 9781119256830
Author: Amos Gilat
Publisher: John Wiley & Sons Inc
expand_more
expand_more
format_list_bulleted
Related questions
Question
Please answer the following question below given the data and question instructions. Answer all parts!! And explain how you created the grpahs, got the results. Thank you.

Transcribed Image Text:2.96-
Construct a stem-and-leaf diagram for these weights (the photo)
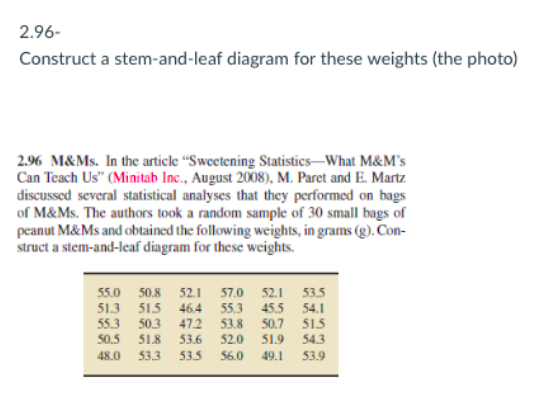
2.96 M&Ms. In the article "Sweetening Statistics-What M&M's
Can Teach Us" (Minitab Inc., August 2008), M. Paret and E. Martz
discussed several statistical analyses that they performed on bags
of M&Ms. The authors took a random sample of 30 small bags of
peanut M&Ms and obtained the following weights, in grams (g). Con-
struct a stem-and-leaf diagram for these weights.
55.0
51.3
55.3
50.8
52.1
46.4
47.2
53.6
57.0 52.1 53.5
55.3
53.8
52.0
45.5 54.1
50.7
51.5
51.5
50.3
50.5
51.8
51.9
54.3
48.0
53.3
53.5
56.0
49.1
53.9
Expert Solution
This question has been solved!
Explore an expertly crafted, step-by-step solution for a thorough understanding of key concepts.

This is a popular solution

Trending nowThis is a popular solution!

Step by stepSolved in 3 steps with 3 images

Knowledge Booster

Similar questions
- find 5th deciels for given data 12,15,42,3,26,36,6,56,32,25,29,67,32,30arrow_forwardThe list shows the score of each game completed at a bowling alley during a one-hour period. 90, 96, 120, 124, 130, 135, 138, 140, 145, 148, 290, 290 Would the mode of the data be an informative measure of center in this situation? Explain your answer.arrow_forwardfind mode of the data 2,3,4,5,6,7,7,6,5,5,5,4,2,1,0,10,77,88,arrow_forward
arrow_back_ios
arrow_forward_ios
Recommended textbooks for you
- MATLAB: An Introduction with ApplicationsStatisticsISBN:9781119256830Author:Amos GilatPublisher:John Wiley & Sons Inc
 Probability and Statistics for Engineering and th...StatisticsISBN:9781305251809Author:Jay L. DevorePublisher:Cengage Learning
 Statistics for The Behavioral Sciences (MindTap C...StatisticsISBN:9781305504912Author:Frederick J Gravetter, Larry B. WallnauPublisher:Cengage Learning
  Elementary Statistics: Picturing the World (7th E...StatisticsISBN:9780134683416Author:Ron Larson, Betsy FarberPublisher:PEARSON
 The Basic Practice of StatisticsStatisticsISBN:9781319042578Author:David S. Moore, William I. Notz, Michael A. FlignerPublisher:W. H. Freeman
 Introduction to the Practice of StatisticsStatisticsISBN:9781319013387Author:David S. Moore, George P. McCabe, Bruce A. CraigPublisher:W. H. Freeman
MATLAB: An Introduction with Applications
Statistics
ISBN:9781119256830
Author:Amos Gilat
Publisher:John Wiley & Sons Inc
Probability and Statistics for Engineering and th...
Statistics
ISBN:9781305251809
Author:Jay L. Devore
Publisher:Cengage Learning
Statistics for The Behavioral Sciences (MindTap C...
Statistics
ISBN:9781305504912
Author:Frederick J Gravetter, Larry B. Wallnau
Publisher:Cengage Learning
Elementary Statistics: Picturing the World (7th E...
Statistics
ISBN:9780134683416
Author:Ron Larson, Betsy Farber
Publisher:PEARSON
The Basic Practice of Statistics
Statistics
ISBN:9781319042578
Author:David S. Moore, William I. Notz, Michael A. Fligner
Publisher:W. H. Freeman
Introduction to the Practice of Statistics
Statistics
ISBN:9781319013387
Author:David S. Moore, George P. McCabe, Bruce A. Craig
Publisher:W. H. Freeman