MATLAB: An Introduction with Applications
6th Edition
ISBN: 9781119256830
Author: Amos Gilat
Publisher: John Wiley & Sons Inc
expand_more
expand_more
format_list_bulleted
Concept explainers
Topic Video
Question

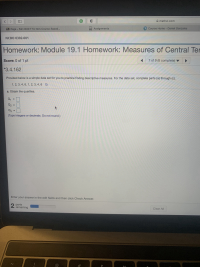
Transcribed Image Text:Provided below is a simple data set for you to practice finding descriptive measures. For the data set, complete parts (a) through (c).
1, 2, 3, 4, 6, 1, 2, 3, 4, 6
a. Obtain the quartiles.
Q1
%3D
Q2
Q3
%3D
(Type integers or decimals. Do not round.)
%3D
Expert Solution
This question has been solved!
Explore an expertly crafted, step-by-step solution for a thorough understanding of key concepts.
This is a popular solution
Trending nowThis is a popular solution!
Step by stepSolved in 2 steps with 11 images

Knowledge Booster
Learn more about
Need a deep-dive on the concept behind this application? Look no further. Learn more about this topic, statistics and related others by exploring similar questions and additional content below.Similar questions
- please asnwer botharrow_forwardBar charts Select an answer and submit. For keyboard navigation, use the up/down arrow keys to select an answer. a Are preferred to Column Charts when labels are long. Cannot be used for clustered bar charts. Are better than column charts when showing averages. d. Are the basis for Box and Whisker Charts.arrow_forwardArm circumferences of 122 outpatients at a clinic in Santa Cruz are measured in centimeters. The resulting data are ... O Numerical and continuous. O Numerical and discrete. O Categorical and ordinal. O Categorical and nominal.arrow_forward
- The box plots below represent the math test scores of Amy and Ed for the spring semester Amy Ed • 68 70 72 74 76 78 80 82 84 86 88 90 92 Which student has the greater median test score? Which student has the greater interquartile range of test scores? Which student has the greater range of test scores? Page 9:26 AM 4/26/2021 TIME OUTarrow_forwardWhich of the following is NOT an example of cross-sectional data?arrow_forwardDraw a box plot for the data set with the statistics in the picturearrow_forward
- The scores and the percents of the final grade for a student in a stats class are given. What is the student's mean score? Complete the thirds columnarrow_forwardWrite one paragraph describing the data set using the histogram. Comment on the shape of the distribution of the data.arrow_forwardhe data set below shows the ages of a random sample of children under the age of 14 who live in an apartment uilding. dake a dot plot to display the data. Children's Ages 7,4,7,7,2, 10, 12, 8, 7, 4arrow_forward
arrow_back_ios
SEE MORE QUESTIONS
arrow_forward_ios
Recommended textbooks for you
 MATLAB: An Introduction with ApplicationsStatisticsISBN:9781119256830Author:Amos GilatPublisher:John Wiley & Sons Inc
 Probability and Statistics for Engineering and th...StatisticsISBN:9781305251809Author:Jay L. DevorePublisher:Cengage Learning
 Statistics for The Behavioral Sciences (MindTap C...StatisticsISBN:9781305504912Author:Frederick J Gravetter, Larry B. WallnauPublisher:Cengage Learning
 Elementary Statistics: Picturing the World (7th E...StatisticsISBN:9780134683416Author:Ron Larson, Betsy FarberPublisher:PEARSON
 The Basic Practice of StatisticsStatisticsISBN:9781319042578Author:David S. Moore, William I. Notz, Michael A. FlignerPublisher:W. H. Freeman
 Introduction to the Practice of StatisticsStatisticsISBN:9781319013387Author:David S. Moore, George P. McCabe, Bruce A. CraigPublisher:W. H. Freeman

MATLAB: An Introduction with Applications
Statistics
ISBN:9781119256830
Author:Amos Gilat
Publisher:John Wiley & Sons Inc

Probability and Statistics for Engineering and th...
Statistics
ISBN:9781305251809
Author:Jay L. Devore
Publisher:Cengage Learning

Statistics for The Behavioral Sciences (MindTap C...
Statistics
ISBN:9781305504912
Author:Frederick J Gravetter, Larry B. Wallnau
Publisher:Cengage Learning

Elementary Statistics: Picturing the World (7th E...
Statistics
ISBN:9780134683416
Author:Ron Larson, Betsy Farber
Publisher:PEARSON

The Basic Practice of Statistics
Statistics
ISBN:9781319042578
Author:David S. Moore, William I. Notz, Michael A. Fligner
Publisher:W. H. Freeman

Introduction to the Practice of Statistics
Statistics
ISBN:9781319013387
Author:David S. Moore, George P. McCabe, Bruce A. Craig
Publisher:W. H. Freeman