MATLAB: An Introduction with Applications
6th Edition
ISBN: 9781119256830
Author: Amos Gilat
Publisher: John Wiley & Sons Inc
expand_more
expand_more
format_list_bulleted
Question

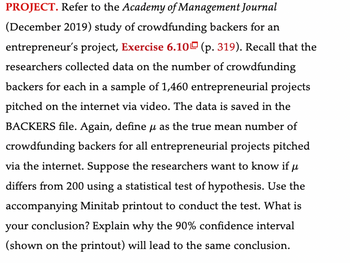
Transcribed Image Text:PROJECT. Refer to the Academy of Management Journal
(December 2019) study of crowdfunding backers for an
entrepreneur's project, Exercise 6.10 (p. 319). Recall that the
researchers collected data on the number of crowdfunding
backers for each in a sample of 1,460 entrepreneurial projects
pitched on the internet via video. The data is saved in the
BACKERS file. Again, define μ as the true mean number of
crowdfunding backers for all entrepreneurial projects pitched
via the internet. Suppose the researchers want to know if μ
differs from 200 using a statistical test of hypothesis. Use the
accompanying Minitab printout to conduct the test. What is
your conclusion? Explain why the 90% confidence interval
(shown on the printout) will lead to the same conclusion.

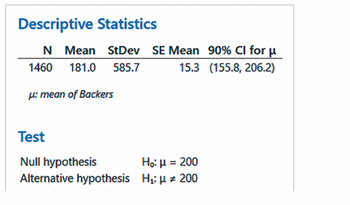
Transcribed Image Text:Descriptive Statistics
N
1460 181.0 585.7
Mean StDev SE Mean
15.3
μ: mean of Backers
Test
Null hypothesis
Alternative hypothesis
Ho: μ = 200
H₁: μ ‡ 200
90% CI for μ
(155.8, 206.2)
Expert Solution
This question has been solved!
Explore an expertly crafted, step-by-step solution for a thorough understanding of key concepts.
This is a popular solution
Trending nowThis is a popular solution!
Step by stepSolved in 2 steps

Knowledge Booster
Similar questions
- A graduate student is interested in how viewing different types of scenes affects working memory. For his study, he selects a random sample of 36 adults. The subjects complete a series of working memory tests before and after walking in an urban setting. Before the walk, the mean score on the test of working memory was 9.1. After the walk, the mean score was 1.4 higher. The graduate student has no presupposed assumptions about how viewing different types of scenes affects working memory, so he formulates the null and alternative hypotheses as: H00 : μDD = 0 H11 : μDD ≠ 0 Assume that the data satisfy all of the required assumptions for a repeated-measures t test. The graduate student calculates the following statistics for his hypothesis test: Mean difference (MDD) 1.4 Estimated population standard deviation of the differences (s) 1.6 Estimated standard error of the mean differences (sMDMD) 0.2667 Degrees of freedom (df) 35 The t statistic 5.25 The critical values of t…arrow_forward5.28 Risks and insurance. The idea of insurance is that we all face risks that are unlikely but carry high cost. Think of a fire destroying your home. So we form a group to share the risk: we all pay a small amount, and the insurance policy pays a large amount to those few of us whose homes burn down. An insurance company looks at the records for millions of homeowners and sees that the mean loss from fire in a year is μ = $250 per house and that the standard deviation of the loss is σ = $1000. (The distribution of losses is extremely right-skewed: most people have $0 loss, but a few have large losses.) The company plans to sell fire insurance for $250 plus enough to cover its costs and profit. If the company sells 25,000 policies, what is the approximate probability that the average loss in a year will be greater than $270?arrow_forwardA study from 2014 found that adults in the US spend an average of 11 hours per day watching, reading, listening to or simply interacting with media. Researchers at UCLA suspect students spend less time engaging media. They grouped UCLA students by class section, randomly selected 20 class sections, and administered a survey to each student in those randomly selected class sections. The following data represents the mean time (in hours) per day spent engaging media for each of the randomly selected classes: 9.5 11.5 6.0 7.5 8 9.5 10.5 11 12 8.2 5 9.5 8.2 9.3 10.8 11 13 8.6 9.5 10.5 What would be the 99% Confidence Interval for mean time (in hours) spent per day engaging media for UCLA students. Do this "by hand", using appripriate symbols/formulas/tables.arrow_forward
- The mean number of sick days an employee takes per year is believed to be about 10.5. Members of a personnel department do not believe this figure. They randomly survey ten employees. The number of sick days they took for the past year are as follows: 12; 4; 15; 3; 11; 8; 6; 8; 2; 9. Let x = the number of sick days they took for the past year. Should the personnel team believe that the mean number is ten?arrow_forwardAs part of a study on transportation safety, the U.S. Department of Transportation collected data on the number of fatal accidents per 1,000 licenses and the percentage of licensed drivers under the age of 21 in a sample of 42 cities. Prepare a managerial report that analyzes the data. Consider the complete data set collected over a one-year period. Safety Percent Under 21 Fatal Accidents per 1000 12 2.942 11 0.688 7 0.865 11 1.632 10 2.071 16 2.607 17 3.81 7 0.348 12 1.122 7 0.625 8 1.008 15 2.781 11 1.385 8 1.413 9 0.019 8 0.318 10 1.829 11 2.226 13 2.835 13 2.332 10 1.274 16 4.08 7 2.17 15 3.603 14 2.603 8 0.815 7 0.8 13 2.87 7 1.247 14 3.204 9 0.994 9 0.473 13 1.423 17 3.594 9 1.906 13 1.623 15 2.923 11 1.893 14 2.794 12 2.614 8 0.906 16 3.236 Find the mean and standard deviation of licensed drivers under the age of 21. (Round your answers to two decimal places.) MeanStandard deviation Find…arrow_forwardUsed car auctions give car dealers an opportunity to increase their used car inventory by purchasing cars used as rental cars, assigned to company executives, and other similar activities. Suppose population 1 is all black cars sold at used car auctions, and population 2 is all white cars sold at used car auctions. Of interest is to estimate the difference in the mean sale price of all black cars sold at used car auctions and the mean sale price of all white cars sold at used car auctions. Based on this, using both the appropriate symbol and in words, state the one parameter of interest.arrow_forward
- 5t. A magazine reports that women trust recommendations from a particular social networking site more than recommendations from any other social network platform. But does trust in this social networking site differ by gender? The following sample data show the number of women and men who stated in a recent sample that they trust recommendations made on this particular social networking site. Women Men Sample 150 170 Trust RecommendationsMade on the social networking site 111 102 (a) What is the point estimate of the proportion of women who trust recommendations made on this particular social networking site? (b) What is the point estimate of the proportion of men who trust recommendations made on this particular social networking site? (c) Provide a 95% confidence interval estimate of the difference between the proportion of women and men who trust recommendations made on this particular social networking site. (Round your answers to four decimal places.)arrow_forwardA study from 2014 found that adults in the US spend an average of 11 hours per day watching, reading, listening to or simply interacting with media. Researchers at UCLA suspect students spend less time engaging media. They grouped UCLA students by class section, randomly selected 20 class sections, and administered a survey to each student in those randomly selected class sections. The following data represents the mean time (in hours) per day spent engaging media for each of the randomly selected classes: 9.5 11.5 6.0 7.5 8 9.5 10.5 11 12 8.2 5 9.5 8.2 9.3 10.8 11 13 8.6 9.5 10.5 What would be the calculator steps to find standard deviaton, rounded to 3 decimal places?arrow_forwardAn observational study of teams fishing for the red spiny lobster in a certain body of water was conducted and the results published in a science magazine. One of the variables of interest was the average distance separating traps - called "trap spacing" - deployed by the same team of fishermen. Trap spacing measurements (in meters) for a sample of seven teams of fishermen are shown in the accompanying table. Of interest is the mean trap spacing for the population of red spiny lobster fishermen fishing in this body of water. Complete parts a through f below. E Click the icon to view the trap spacing data. Trap Spacing Data a. Identify the target parameter for this study. The target parameter for this study is 93 101 107 95 81 68 84 b. Compute a point estimate of the target parameter. (Round to two decimal places as needed.) Print Done c. What is the problem with using the normal (z) statistic to finda confidence interval for the target parameter? O A. The point estimate is too large to…arrow_forward
arrow_back_ios
arrow_forward_ios
Recommended textbooks for you
 MATLAB: An Introduction with ApplicationsStatisticsISBN:9781119256830Author:Amos GilatPublisher:John Wiley & Sons Inc
 Probability and Statistics for Engineering and th...StatisticsISBN:9781305251809Author:Jay L. DevorePublisher:Cengage Learning
 Statistics for The Behavioral Sciences (MindTap C...StatisticsISBN:9781305504912Author:Frederick J Gravetter, Larry B. WallnauPublisher:Cengage Learning
 Elementary Statistics: Picturing the World (7th E...StatisticsISBN:9780134683416Author:Ron Larson, Betsy FarberPublisher:PEARSON
 The Basic Practice of StatisticsStatisticsISBN:9781319042578Author:David S. Moore, William I. Notz, Michael A. FlignerPublisher:W. H. Freeman
 Introduction to the Practice of StatisticsStatisticsISBN:9781319013387Author:David S. Moore, George P. McCabe, Bruce A. CraigPublisher:W. H. Freeman

MATLAB: An Introduction with Applications
Statistics
ISBN:9781119256830
Author:Amos Gilat
Publisher:John Wiley & Sons Inc

Probability and Statistics for Engineering and th...
Statistics
ISBN:9781305251809
Author:Jay L. Devore
Publisher:Cengage Learning

Statistics for The Behavioral Sciences (MindTap C...
Statistics
ISBN:9781305504912
Author:Frederick J Gravetter, Larry B. Wallnau
Publisher:Cengage Learning

Elementary Statistics: Picturing the World (7th E...
Statistics
ISBN:9780134683416
Author:Ron Larson, Betsy Farber
Publisher:PEARSON

The Basic Practice of Statistics
Statistics
ISBN:9781319042578
Author:David S. Moore, William I. Notz, Michael A. Fligner
Publisher:W. H. Freeman

Introduction to the Practice of Statistics
Statistics
ISBN:9781319013387
Author:David S. Moore, George P. McCabe, Bruce A. Craig
Publisher:W. H. Freeman