
MATLAB: An Introduction with Applications
6th Edition
ISBN: 9781119256830
Author: Amos Gilat
Publisher: John Wiley & Sons Inc
expand_more
expand_more
format_list_bulleted
Related questions
Question
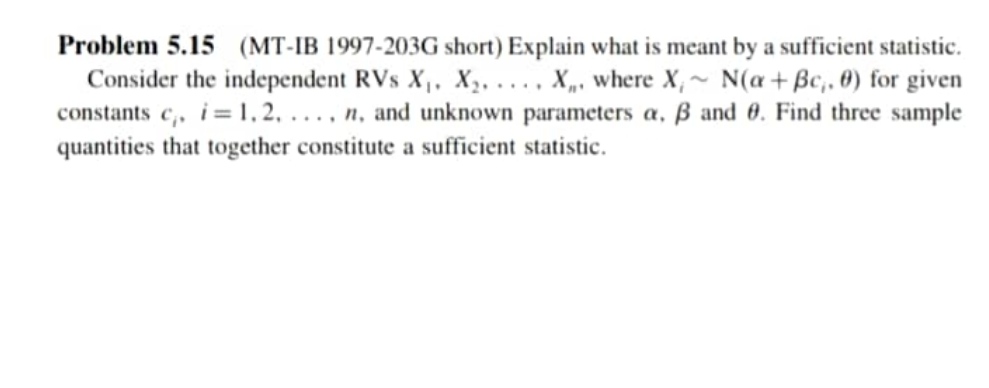

Transcribed Image Text:Problem 5.15 (MT-IB 1997-203G short) Explain what is meant by a sufficient statistic.
Consider the independent RVs X,, X,. ..., X„, where X,~ N(a+Bc,. 0) for given
constants c,, i=1, 2, . . , n, and unknown parameters a, ß and 0. Find three sample
quantities that together constitute a sufficient statistic.
Expert Solution
This question has been solved!
Explore an expertly crafted, step-by-step solution for a thorough understanding of key concepts.

Step by stepSolved in 3 steps with 3 images

Knowledge Booster

Similar questions
- 14) Assume that you want to test the claim that the paired sample data come from a population for which the mean difference is u, = 0. Compute the value of the t test statistic. Round %3D intermediate calculations to four decimal places as needed and final answers to three decimal places as needed. х 28 31 20 25 28 27 33 35 26 27 26 25 29 32 33 34 A) t =-1.480 B) t=-1.185 C) t = -0.523 D) t= 0.690 %3Darrow_forwardAn apple orchard farmer wants to know the true population proportion of all apples harvested at their farm which have the less valuable condition of being blemished, or in other words, are cider apples. This true population proportion is a parameter value represented by the symbol p. As a population parameter, this value can never be known with certainty. It can however, be estimated with varying levels of confidence. To estimate this parameter p, the farmer draws a simple random sample (SRS) of 524 apples from the orchard. Within this sample, the farmer finds that exactly 47 of the apples are cider apples. The farmer then computes a 96%-level confidence interval estimate for the parameter p. In percentage form, and rounded to four digits past the decimal point: What is the approximate value of the Lower Limit of this confidence interval? Include a percentage symbol at the end of your numerical answer (with no spaces).arrow_forward26. In a two-tailed hypothesis about a population mean with a random sample size of 100 and a 0.05 level of significance, which of the following describes the appropriate critical region? А. z > 1.645 В. z 1.645 z 1.96 С. D. z > 1.96arrow_forward
- ent FUR Chapter 09, Section 9.2, Problem 019 For the following significance level, what is the probability of making a Type I error? a = 0.01 exact number, no tolerance Question Attempts: 0 of 2 hulu W étvarrow_forward5.The average annual miles driven per vehicle in the United States is 11.1thousand miles,withs600 miles.Suppose that a random sampleof 26 vehicles owned by residents of Chicago showed that the averagemileage driven last year was 10.8 thousand miles.Does this indicate tha 6.the average miles driven per vehicle in Chicago is different from(higher or lower than)the national average?Use a 0.05 level of significance. What are we testing in this problem?1)single proportion ii)single mean(a)What is the level of significance? State the null and alternate hypotheses.arrow_forward4) Suppose an x distribution with u = 12 and standard deviation 6. Consider two corresponding x distributions, the first based on sample size n = 36 and the second with sample size n = 64. a) What is the value of the mean and standard deviation of the two x distributions? First: Hx = Ox= - Ox=- Second: ux =arrow_forward
- 17.arrow_forward8.What is the sample variance and the estimated standard error for a sample of n = 9 scores with SS = 72? a. s2= 9 and sM = 3 c. s²= 3 and sM = 3 b. s? = 9 and SM = 1 d. s2 = 3 and sM= 1 %3Darrow_forwardDasani has two machines at a particular plant that are used for filling their plastic water bottles (nominal volume 16 ounces). The quality engineering department tells the plant manager that both machines fill to the same net volume (whether or not this volume averages 16.0 ounces). A random sample is taken from the output of the each machine. Table 1-Measured volume of water per bottle (fluid ounces) Machine 1 Machine 2 16.03 16.01 16.02 16.03 16.04 15.96 15.97 16.04 16.05 15.98 15.96 16.02 16.05 16.02 16.01 16.01 16.02 15.99 15.99 16.00 Do you think the quality engineering department is correct? Derive your answer from a complete hypothesis testing process.arrow_forward
arrow_back_ios
arrow_forward_ios
Recommended textbooks for you
- MATLAB: An Introduction with ApplicationsStatisticsISBN:9781119256830Author:Amos GilatPublisher:John Wiley & Sons Inc
 Probability and Statistics for Engineering and th...StatisticsISBN:9781305251809Author:Jay L. DevorePublisher:Cengage Learning
 Statistics for The Behavioral Sciences (MindTap C...StatisticsISBN:9781305504912Author:Frederick J Gravetter, Larry B. WallnauPublisher:Cengage Learning
  Elementary Statistics: Picturing the World (7th E...StatisticsISBN:9780134683416Author:Ron Larson, Betsy FarberPublisher:PEARSON
 The Basic Practice of StatisticsStatisticsISBN:9781319042578Author:David S. Moore, William I. Notz, Michael A. FlignerPublisher:W. H. Freeman
 Introduction to the Practice of StatisticsStatisticsISBN:9781319013387Author:David S. Moore, George P. McCabe, Bruce A. CraigPublisher:W. H. Freeman
MATLAB: An Introduction with Applications
Statistics
ISBN:9781119256830
Author:Amos Gilat
Publisher:John Wiley & Sons Inc
Probability and Statistics for Engineering and th...
Statistics
ISBN:9781305251809
Author:Jay L. Devore
Publisher:Cengage Learning
Statistics for The Behavioral Sciences (MindTap C...
Statistics
ISBN:9781305504912
Author:Frederick J Gravetter, Larry B. Wallnau
Publisher:Cengage Learning
Elementary Statistics: Picturing the World (7th E...
Statistics
ISBN:9780134683416
Author:Ron Larson, Betsy Farber
Publisher:PEARSON
The Basic Practice of Statistics
Statistics
ISBN:9781319042578
Author:David S. Moore, William I. Notz, Michael A. Fligner
Publisher:W. H. Freeman
Introduction to the Practice of Statistics
Statistics
ISBN:9781319013387
Author:David S. Moore, George P. McCabe, Bruce A. Craig
Publisher:W. H. Freeman