Question
Which graph best represents the the magnitude of the voltage measured across the resistor by the voltmeter labeled VR?

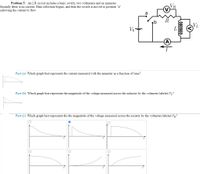
Transcribed Image Text:Problem 5: An LR circuit includes a basic switch, two voltmeters and an ammeter.
Initially there is no current. Data collection begins, and then the switch is moved to position "a"
allowing the current to flow.
a
VL
Vo-
Part (a) Which graph best represents the current measured with the ammeter as a function of time?
Part (b) Which graph best represents the magnitude of the voltage measured across the inductor by the voltmeter labeled V?
Part (c) Which graph best represents the the magnitude of the voltage measured across the resistor by the voltmeter labeled VR?
Expert Solution
This question has been solved!
Explore an expertly crafted, step-by-step solution for a thorough understanding of key concepts.
This is a popular solution
Trending nowThis is a popular solution!
Step by stepSolved in 3 steps with 3 images

Knowledge Booster
Similar questions
- True or False. As the charge in the capacitor increases, the voltage AV_R across the resistor decreases. Please explain why this is true.arrow_forwardWhat is the potential difference across the 20 ΩΩ resistor?arrow_forwardAn RC circuit includes a basic switch, two voltmeters and an ammeter. Initially the capacitor is either partially or fully charged, and the switch is open. Data collection begins, and then the switch is moved to position "b" allowing the capacitor to begin discharging. Part 1: Which graph best represents the magnitude of the voltage measured across the capacitor by the voltmeter labeled Vc? O O t Part (a) Which graph best represents the charge on the positive plate of the capacitor as a function of time? O O O Vo O a o .b Part 2: Which graph best represents the magnitude of the voltage measured across the resistor by the voltmeter labeled VR? O Part (b) Which graph best represents the current measured with the ammeter as a function of time? O R t A I O Vcarrow_forward
- A heart pacemaker fires exactly 71 times a minute. Each time it fires, a 19.0 nF capacitor is charged by a battery in series with a resistor to 0.582 of its full voltage. What is the value of the resistance R? R =arrow_forwardA capacitor with capacitance C = 5 µF is charged to a voltage V = 10V. It is then discharged through a resistor R=2 MQ. At what time after the start of the discharge process has the voltage across the capacitor fallen to 1V?arrow_forward-/1 Points] DETAILS SERCP10 18.P.035. A charged capacitor is connected to a resistor and a switch as in the figure below. The circuit has a time constant of 2.50 s. Soon after the switch is closed, the charge on the capacitor is 81.0% of its initial charge. +Q www R (a) Find the time interval required for the capacitor to reach this charge. S (b) If R= 200 kn, what is the value of C? UFarrow_forward
- Three resistors are connected as shown below. R1 = 3.0 Ω, R2 = 6.0 Ω, and R3 = 8.0 Ω. The voltage across the battery is 60 V. What is the current through R1, in Amperes?arrow_forwardWhat is the voltage drop across R in the circuit below if the shown resistances have the following values: R1=10 N R2=10 N R3=10 N and the voltage provided by the voltage source is 13 volts. R1 R2 R3 adap fo Varrow_forwardWhat is the maximum voltage that can be applied to a 186 k ohm resistor rated at 16 watts? Give your answer as an exact number. Your Answer: Answerarrow_forward
- Circuit Problem: Express each labelled voltage and current (e.g., vx, ix) in terms of the resistances and source currents and voltages (e.g., R0).arrow_forwardTwo capacitors are connected in series and a source voltage of 75 Volts is applied across the entire series configuration. If the resistors have values 120 and 50 micro- Farads, how much charge is on the 120 μF capacitor? Express your answer in micro- Coulombs (C).arrow_forward
arrow_back_ios
arrow_forward_ios