MATLAB: An Introduction with Applications
6th Edition
ISBN: 9781119256830
Author: Amos Gilat
Publisher: John Wiley & Sons Inc
expand_more
expand_more
format_list_bulleted
Question

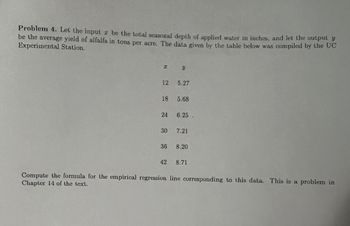
Transcribed Image Text:Problem 4. Let the input x be the total seasonal depth of applied water in inches, and let the output y
be the average yield of alfalfa in tons per acre. The data given by the table below was compiled by the UC
Experimental Station.
I
12
18
24
30
36
42
y
5.27
5.68
6.25.
7.21
8.20
8.71
Compute the formula for the empirical regression line corresponding to this data. This is a problem in
Chapter 14 of the text.
Expert Solution
This question has been solved!
Explore an expertly crafted, step-by-step solution for a thorough understanding of key concepts.
This is a popular solution
Trending nowThis is a popular solution!
Step by stepSolved in 3 steps with 5 images

Knowledge Booster
Similar questions
- Question 2 The following table shows the mean weight in kilograms of members of a group of young children of various ages. Age (x years) 1.6 2.5 3.3 4.4 5.6 Weight ( y kg) 12 15 16 17 20 The relationship between the variables is modeled by the regression line with equation y=ax+by=ax+barrow_forwardYou are interesting in how rats' weights influence their running speed. For a group of 6 rats, you weigh them (in kg) and then time them in a race (in s). The data are given in the following table. Subject A B С OE D E Weight (kg) Time (s) 1.1 0.8 0.9 0.7 1.2 1.1 F Find the regression line that represents the relationship between your predictor variable (Weight) and your criterion variable (Time). SP or SSXY = [Select] SSX or SSXX= [Select] 110 90 70 80 100 SSY or SSYY = [Select] 85 The slope of the line (b) = [Select] The intercept of the line (a) = [Select] Find the standard error of the estimate for the regression above: [Select]arrow_forwardquestion darrow_forward
- Question 3 A. The information below shows the age and the number of sick days taken for 6 employees at a biscuit factory. Age(x) 18 26 39 48 53 58 Number of sick days(Y) 16 12 9 5 6 2 Table 3. Using the information above: i. Determine the product-moment coefficient (r) ii. Calculate the coefficient of determination and interpret your answer iii. Determine the equation of the regression line iv. Use the equation of the regression line to estimate the number of sick days that would be taken by an employee who is 47.arrow_forwardParts A, C, and D. Can you put them all on one excel graph please. It should be one figure with three lines.arrow_forwardQuestion #8 Use the given data to find the equation of the regression line. Examine the scatterplot and identify a characteristic of the data that is ignored by the regression line. x 12 6 10 13 11 5 8 14 9 7 15 y 14.29 6.91 13.15 14.37 13.88 4.53 10.69 14.11 12.08 8.97 13.53 y= ________ + ________ x (Round to two decimal places as needed.) Create a scatterplot of the data. Choose the correct graph below. ( Grapghs are attached) Identify a characteristic of the data that is ignored by the regression line. A. There is no trend in the data. B. There is an influential point that strongly affects the graph of the regression line. C. The data has a pattern that is not a straight line. D. There is no characteristic of the data that is ignored by the regression line.arrow_forward
arrow_back_ios
arrow_forward_ios
Recommended textbooks for you
 MATLAB: An Introduction with ApplicationsStatisticsISBN:9781119256830Author:Amos GilatPublisher:John Wiley & Sons Inc
 Probability and Statistics for Engineering and th...StatisticsISBN:9781305251809Author:Jay L. DevorePublisher:Cengage Learning
 Statistics for The Behavioral Sciences (MindTap C...StatisticsISBN:9781305504912Author:Frederick J Gravetter, Larry B. WallnauPublisher:Cengage Learning
 Elementary Statistics: Picturing the World (7th E...StatisticsISBN:9780134683416Author:Ron Larson, Betsy FarberPublisher:PEARSON
 The Basic Practice of StatisticsStatisticsISBN:9781319042578Author:David S. Moore, William I. Notz, Michael A. FlignerPublisher:W. H. Freeman
 Introduction to the Practice of StatisticsStatisticsISBN:9781319013387Author:David S. Moore, George P. McCabe, Bruce A. CraigPublisher:W. H. Freeman

MATLAB: An Introduction with Applications
Statistics
ISBN:9781119256830
Author:Amos Gilat
Publisher:John Wiley & Sons Inc

Probability and Statistics for Engineering and th...
Statistics
ISBN:9781305251809
Author:Jay L. Devore
Publisher:Cengage Learning

Statistics for The Behavioral Sciences (MindTap C...
Statistics
ISBN:9781305504912
Author:Frederick J Gravetter, Larry B. Wallnau
Publisher:Cengage Learning

Elementary Statistics: Picturing the World (7th E...
Statistics
ISBN:9780134683416
Author:Ron Larson, Betsy Farber
Publisher:PEARSON

The Basic Practice of Statistics
Statistics
ISBN:9781319042578
Author:David S. Moore, William I. Notz, Michael A. Fligner
Publisher:W. H. Freeman

Introduction to the Practice of Statistics
Statistics
ISBN:9781319013387
Author:David S. Moore, George P. McCabe, Bruce A. Craig
Publisher:W. H. Freeman