MATLAB: An Introduction with Applications
6th Edition
ISBN: 9781119256830
Author: Amos Gilat
Publisher: John Wiley & Sons Inc
expand_more
expand_more
format_list_bulleted
Question
Step 1 of 3 :
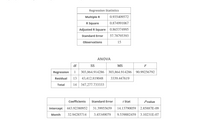
Write the estimated regression equation using the least squares estimates for b0
and b1. Round to four decimal places, if necessary.

Transcribed Image Text:Regression Statistics
Multiple R
0.935409572
R Square
0.874991067
Adjusted R Square
0.865374995
Standard Error
57.78795393
Observations
15
ANOVA
df
SS
MS
F
Regression
1
303,864.914286
303,864.914286
90.99256792
Residual
13
43,412.819048
3339.447619
Total
14
347,277.733333
Coefficients
Standard Error
t Stat
P-value
Intercept
443.92380952
31.39955659
14.13790059
2.85887E-09
Month
32.94285714
3.45349079
9.539002459
3.10231E-07

Transcribed Image Text:Consider the following monthly revenue data for an up-and-coming technology company.
Sales Data
Month
Revenue (Thousands of Dollars)
Month
Revenue (Thousands of Dollars)
1
325
9.
797
2
547
10
819
3
539
11
831
4
580
12
848
5
640
13
860
6.
699
14
863
7
697
15
859
8
708
Expert Solution
This question has been solved!
Explore an expertly crafted, step-by-step solution for a thorough understanding of key concepts.
This is a popular solution
Trending nowThis is a popular solution!
Step by stepSolved in 2 steps

Knowledge Booster
Similar questions
- A biologist wants to predict the height of male giraffes, y, in feet, given their age, x1, in years, weight, x2, in pounds, and neck length, x3, in feet. She obtains the multiple regression equation yˆ=7.36+0.00895x1+0.000426x2+0.913x3. Predict the height of a 12-year-old giraffe that weighs 3,100 pounds and has a 7-foot-long neck, rounding to the nearest foot.arrow_forwardRefer to the data set: x -1 1 -2 3 0 2 y 9 2 15 1 4 1.5 Part a: Make a scatterplot and determine which type of model best fits the data.Part b: Find the regression equation, round decimals to one place.Part c: Use the equation from Part b to determine y when x = 5.arrow_forwardA student used multiple regression analysis to study how family spending (y) is influenced by income (X1), family size (x2), and additions to savings (x3). The variables y, x1, and x3 are measured in thousands of dollars. The following results were obtained.arrow_forward
- Provide an example of a research project in your hometown where you would choose to use linear regression. What variable would be your Y-score, and what variable would be your X-score? What does a regression line represent? What is the standard error of estimate?arrow_forwardThe managing director of a consulting group has the accompanying monthly data on total overhead costs and professional labor hours to bill to clients. Complete parts a through c Click the icon to view the monthly data. a. Develop a simple linear regression model between billable hours and overhead costs. Overhead Costs = 247733.3 +(43.2000) x Billable Hours (Round the constant to one decimal place as needed. Round the coefficient to four decimal places as needed. Do not include the $ symbol in your answers.) b. Interpret the coefficients of your regression model. Specifically, what does the fixed component of the model mean to the consulting firm? Interpret the fixed term, bo. if appropriate. Choose the correct answer below. OA. The value of by is the predicted overhead costs for 0 billable hours. OB. For each increase of 1 unit in overhead costs, the predicted billable hours are estimated to increase by bo OC. It is not appropriate to interpret by. because its value is the predicted…arrow_forwardWrite out the full linear model including all dummy variables below. Don’t worry about estimating regression coefficients just yet. Feel free to abbreviate variable names so long as they are clearly distinguishable.arrow_forward
- Use B = -15.812961, and ₁ = 0.096300 to determine the equation of the estimated regression line. (Round your numerical answers to four decimal places.) ŷ =arrow_forwardCompute the least-squares regression equation for the given data set. Round the slope and yFintercept to at least four decimal places. 4 y 7. 3. Send data to Excel Regression line equation: y =|arrow_forward
arrow_back_ios
arrow_forward_ios
Recommended textbooks for you
 MATLAB: An Introduction with ApplicationsStatisticsISBN:9781119256830Author:Amos GilatPublisher:John Wiley & Sons Inc
 Probability and Statistics for Engineering and th...StatisticsISBN:9781305251809Author:Jay L. DevorePublisher:Cengage Learning
 Statistics for The Behavioral Sciences (MindTap C...StatisticsISBN:9781305504912Author:Frederick J Gravetter, Larry B. WallnauPublisher:Cengage Learning
 Elementary Statistics: Picturing the World (7th E...StatisticsISBN:9780134683416Author:Ron Larson, Betsy FarberPublisher:PEARSON
 The Basic Practice of StatisticsStatisticsISBN:9781319042578Author:David S. Moore, William I. Notz, Michael A. FlignerPublisher:W. H. Freeman
 Introduction to the Practice of StatisticsStatisticsISBN:9781319013387Author:David S. Moore, George P. McCabe, Bruce A. CraigPublisher:W. H. Freeman

MATLAB: An Introduction with Applications
Statistics
ISBN:9781119256830
Author:Amos Gilat
Publisher:John Wiley & Sons Inc

Probability and Statistics for Engineering and th...
Statistics
ISBN:9781305251809
Author:Jay L. Devore
Publisher:Cengage Learning

Statistics for The Behavioral Sciences (MindTap C...
Statistics
ISBN:9781305504912
Author:Frederick J Gravetter, Larry B. Wallnau
Publisher:Cengage Learning

Elementary Statistics: Picturing the World (7th E...
Statistics
ISBN:9780134683416
Author:Ron Larson, Betsy Farber
Publisher:PEARSON

The Basic Practice of Statistics
Statistics
ISBN:9781319042578
Author:David S. Moore, William I. Notz, Michael A. Fligner
Publisher:W. H. Freeman

Introduction to the Practice of Statistics
Statistics
ISBN:9781319013387
Author:David S. Moore, George P. McCabe, Bruce A. Craig
Publisher:W. H. Freeman