
MATLAB: An Introduction with Applications
6th Edition
ISBN: 9781119256830
Author: Amos Gilat
Publisher: John Wiley & Sons Inc
expand_more
expand_more
format_list_bulleted
Related questions
Question
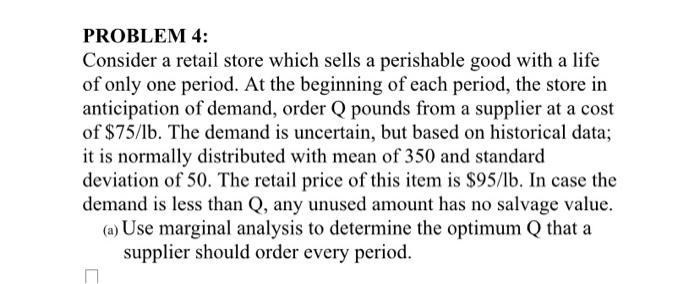

Transcribed Image Text:PROBLEM 4:
Consider a retail store which sells a perishable good with a life
of only one period. At the beginning of each period, the store in
anticipation of demand, order Q pounds from a supplier at a cost
of $75/lb. The demand is uncertain, but based on historical data;
it is normally distributed with mean of 350 and standard
deviation of 50. The retail price of this item is $95/lb. In case the
demand is less than Q, any unused amount has no salvage value.
(a) Use marginal analysis to determine the optimum Q that a
supplier should order every period.
Expert Solution
This question has been solved!
Explore an expertly crafted, step-by-step solution for a thorough understanding of key concepts.

This is a popular solution

Trending nowThis is a popular solution!

Step by stepSolved in 2 steps with 2 images

Knowledge Booster

Similar questions
- An operation analyst is forecasting this year's demand for one of his company's products based on the following historical data: (4 year ago Quantity sold was 1059), (3 year ago Quantity sold was 1169 ), (2 year ago Quantity sold was 1740 ) and the last year Quantity sold was 1903 . The previous trend line had predicted 1218 for three years ago, 1287 for two years ago and 1355 for last year. What was the mean squared error (MSE) for these forecasts? a. 169304.67 b. 19.67 c. 350 d. 0.2arrow_forwardSuppose the mean monthly return on a T-Bill is 0.5% with a standard deviation of 0.58%. Sup-pose we have another investment Y with a 1.5% mean monthly return and standard deviationof 6%. Which of the two investments o ers less risk in terms of investment.arrow_forwardFor a population with a mean of ? = 80 and a standard deviation of ? = 12, a score of X = 77 corresponds to z = −0.50. True or false?arrow_forward
- For each problem, select the best response. (a) The scores of adults on an IQ test is approximately Normal with mean 100 and standard deviation 15. Corinne scores 118 on such test. Her z-score is about O A. 0.67 OB. 1.2 O C. 7.87 OD. 18 O E. None of the above. (b) A researcher wishes to determine whether the rate of water flow (in liters per second) over an experimental soil bed can be used to predict the amount of soil washed away (in kilograms). In this study, the explanatory variable is the O A. size of the soil bed. O B. rate of water flow. OC. amount of eroded soil. O D. depth of the soil bed. O E. None of the above. (c) Smokers don't live as long (on the average) as nonsmokers, and heavy smokers don't live as long as light smokers. You regress the age at death of a group of male smokers on the number of packs per day they smoked. The slope of your regression line A. will be greater than zero. OB. will be less than zero. OC. must be between 1 and 1. D. can't tell without seeing…arrow_forwardA Scenario: Jimmy store sells large tins of Tom Tucker Coffee. The deli uses a periodic review system. Inventory is checked every 10 days which more orders are needed for tins. Order lead time is 3 days. Average demand is 7 tins, so average demand during the reorder period and order lead time (13) is 91 tins. Standard deviation of demand during the same 13 day period is 17 tins.1. Calculate the restocking level ( Assume the desired level is 90%)2. Suppose standard deviation of demand during the 13-day period drops to 4 tins. What happened to restocking level? Explain why?3. Draw a saw-tooth diagram. Beginning inventory level is equal to restocking level and the demand rate is a constant 7 tins per day. What is the safety stock level? What is the average inventory level?arrow_forwardSuppose that the index model for stocks A and B is estimated from excess returns with the following results: RA= 2.0% + 0.40RM + eA RB = -1.8%+ 0.9RM + eB OM = 15%; R-squareA = 0.30; R-squareB = 0.22 What is the standard deviation of each stock? Note: Do not round intermediate calculations. Round your answers to 2 decimal places. Stock A Stock B Standard Deviation % %arrow_forward
arrow_back_ios
arrow_forward_ios
Recommended textbooks for you
- MATLAB: An Introduction with ApplicationsStatisticsISBN:9781119256830Author:Amos GilatPublisher:John Wiley & Sons Inc
 Probability and Statistics for Engineering and th...StatisticsISBN:9781305251809Author:Jay L. DevorePublisher:Cengage Learning
 Statistics for The Behavioral Sciences (MindTap C...StatisticsISBN:9781305504912Author:Frederick J Gravetter, Larry B. WallnauPublisher:Cengage Learning
  Elementary Statistics: Picturing the World (7th E...StatisticsISBN:9780134683416Author:Ron Larson, Betsy FarberPublisher:PEARSON
 The Basic Practice of StatisticsStatisticsISBN:9781319042578Author:David S. Moore, William I. Notz, Michael A. FlignerPublisher:W. H. Freeman
 Introduction to the Practice of StatisticsStatisticsISBN:9781319013387Author:David S. Moore, George P. McCabe, Bruce A. CraigPublisher:W. H. Freeman
MATLAB: An Introduction with Applications
Statistics
ISBN:9781119256830
Author:Amos Gilat
Publisher:John Wiley & Sons Inc
Probability and Statistics for Engineering and th...
Statistics
ISBN:9781305251809
Author:Jay L. Devore
Publisher:Cengage Learning
Statistics for The Behavioral Sciences (MindTap C...
Statistics
ISBN:9781305504912
Author:Frederick J Gravetter, Larry B. Wallnau
Publisher:Cengage Learning
Elementary Statistics: Picturing the World (7th E...
Statistics
ISBN:9780134683416
Author:Ron Larson, Betsy Farber
Publisher:PEARSON
The Basic Practice of Statistics
Statistics
ISBN:9781319042578
Author:David S. Moore, William I. Notz, Michael A. Fligner
Publisher:W. H. Freeman
Introduction to the Practice of Statistics
Statistics
ISBN:9781319013387
Author:David S. Moore, George P. McCabe, Bruce A. Craig
Publisher:W. H. Freeman