MATLAB: An Introduction with Applications
6th Edition
ISBN: 9781119256830
Author: Amos Gilat
Publisher: John Wiley & Sons Inc
expand_more
expand_more
format_list_bulleted
Question

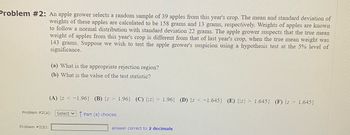
Transcribed Image Text:Problem #2: An apple grower selects a random sample of 39 apples from this year's crop. The mean and standard deviation of
weights of these apples are calculated to be 158 grams and 13 grams, respectively. Weights of apples are known
to follow a normal distribution with standard deviation 22 grams. The apple grower suspects that the true mean
weight of apples from this year's crop is different from that of last year's crop, when the true mean weight was
143 grams. Suppose we wish to test the apple grower's suspicion using a hypothesis test at the 5% level of
significance.
(a) What is the appropriate rejection region?
(b) What is the value of the test statistic?
Problem #2(b):
(A) {z < -1.96} (B) {z 1.96) (C) {z 1.96} (D) {z < -1.645} (E) {z 1.645} (F) {z > 1.645}
Problem #2(a): Select Part (a) choices.
answer correct to 2 decimals
Expert Solution
This question has been solved!
Explore an expertly crafted, step-by-step solution for a thorough understanding of key concepts.
Step by stepSolved in 6 steps with 16 images

Knowledge Booster
Similar questions
- Problem #2: An apple grower selects a random sample of 31 apples from this year's crop. The mean and standard deviation of weights of these apples are calculated to be 155 grams and 12 grams, respectively. Weights of apples are known to follow a normal distribution with standard deviation 21 grams. The apple grower suspects that the true mean weight of apples from this year's crop is different from that of last year's crop, when the true mean weight was 142 grams. Suppose we wish to test the apple grower's suspicion using a hypothesis test at the 1% level of significance. (a) What is the appropriate rejection region? (b) What is the value of the test statistic? Problem #2(b): (A) {|z> 2.575) (B) {z > 2.33) (C) (z 2.575) (D) {z 2.33) (E) {z < -2.33} (F) {z < -2.575} Problem #2(a): Select Part (a) choices. answer correct to 2 decimalsarrow_forward#2) A large warehouse installed a security system a few years ago. Under an older system the managers estimated that they were losing an average of $678 worth of goods to thieves each week. A random sample of 36 weekly records under the current system showed that they were still losing an average of $650 worth of goods each week. The sample standard deviation was s = $93. Does this indicate that the average loss is different (either more or less) than the previous $678 per week? Use a 5% level of significance.arrow_forwardProblem 26. Boxes of Instant Dinner have a marked weight of 12.2 oz. In reality, the weights of the boxes are normally distributed with a mean of 12.8 oz and a standard deviation of 0.3 oz. Use the 68-95-99.7 Rule to determine the percent of the boxes that contain more than 12.2 oz.arrow_forward
- There are many situations in which we want to compare means from populations having standard deviations that are equal. This method applies even if the standard deviations are known to be only approximately equal. Consider a report regarding average incidence of fox rabies in two regions. For region I, n1 = 16, x1 ≈ 4.73, and s1 = 2.84 and for region II, n2 = 15, x2 ≈ 3.93, and s2 = 2.45. The two sample standard deviations are sufficiently close that we can assume ?1 = ?2. Use the method of pooled standard deviation to consider the report, testing if there is a difference in population mean average incidence of rabies at the 5% level of significance. (Round your answer to three decimal places.) t =arrow_forwardQUESTION 5. The English department at Arizona State University measured the vocabularies of its entire undergraduate student body by having each student give definitions of words on 10 selected pages of a dictionary and then multiplying the number of correct definitions by a factor that accounted for the total number of words in that dictionary. The English department concluded that the 44,445 students' vocabularies were normally distributed around mean of 37,500 words with a standard deviation of 8000 words. Based on this data, give the best estimate of how many ASU students had vocabularies between 13,500 and 29,500 words.arrow_forwardSolve question 9, Part A, Part B and Part C only.arrow_forward
arrow_back_ios
arrow_forward_ios
Recommended textbooks for you
 MATLAB: An Introduction with ApplicationsStatisticsISBN:9781119256830Author:Amos GilatPublisher:John Wiley & Sons Inc
 Probability and Statistics for Engineering and th...StatisticsISBN:9781305251809Author:Jay L. DevorePublisher:Cengage Learning
 Statistics for The Behavioral Sciences (MindTap C...StatisticsISBN:9781305504912Author:Frederick J Gravetter, Larry B. WallnauPublisher:Cengage Learning
 Elementary Statistics: Picturing the World (7th E...StatisticsISBN:9780134683416Author:Ron Larson, Betsy FarberPublisher:PEARSON
 The Basic Practice of StatisticsStatisticsISBN:9781319042578Author:David S. Moore, William I. Notz, Michael A. FlignerPublisher:W. H. Freeman
 Introduction to the Practice of StatisticsStatisticsISBN:9781319013387Author:David S. Moore, George P. McCabe, Bruce A. CraigPublisher:W. H. Freeman

MATLAB: An Introduction with Applications
Statistics
ISBN:9781119256830
Author:Amos Gilat
Publisher:John Wiley & Sons Inc

Probability and Statistics for Engineering and th...
Statistics
ISBN:9781305251809
Author:Jay L. Devore
Publisher:Cengage Learning

Statistics for The Behavioral Sciences (MindTap C...
Statistics
ISBN:9781305504912
Author:Frederick J Gravetter, Larry B. Wallnau
Publisher:Cengage Learning

Elementary Statistics: Picturing the World (7th E...
Statistics
ISBN:9780134683416
Author:Ron Larson, Betsy Farber
Publisher:PEARSON

The Basic Practice of Statistics
Statistics
ISBN:9781319042578
Author:David S. Moore, William I. Notz, Michael A. Fligner
Publisher:W. H. Freeman

Introduction to the Practice of Statistics
Statistics
ISBN:9781319013387
Author:David S. Moore, George P. McCabe, Bruce A. Craig
Publisher:W. H. Freeman