
MATLAB: An Introduction with Applications
6th Edition
ISBN: 9781119256830
Author: Amos Gilat
Publisher: John Wiley & Sons Inc
expand_more
expand_more
format_list_bulleted
Related questions
Question

Transcribed Image Text:**Educational Website Transcription: Sampling Scenarios**
In this educational exercise, we are exploring different sampling methods through various scenarios.
**Scenario C:**
Separate random samples of male and female first-year college students in an introductory psychology course are selected to receive a one-week alternative instructional method.
**Scenario D:**
There are eight sections of an introductory statistics course. A random sample of two sections is chosen, and then random samples of eight students from each of these sections are selected.
### Sampling Types for Selection:
- **SRS (Simple Random Sample):** Each individual in the population has an equal chance of being selected.
- **Voluntary Response Sample:** Individuals choose themselves whether to participate.
- **Multistage Random Sample:** A combination of two or more sampling methods, often involving selecting samples in stages.
- **Stratified Random Sample:** The population is divided into subgroups (strata), and random samples are drawn from each stratum.
#### Dropdown Options:
For each scenario (A, B, C, D), there is a dropdown menu allowing users to choose the appropriate sampling method.
This setup encourages students to critically analyze scenarios and select the most suitable sampling method.
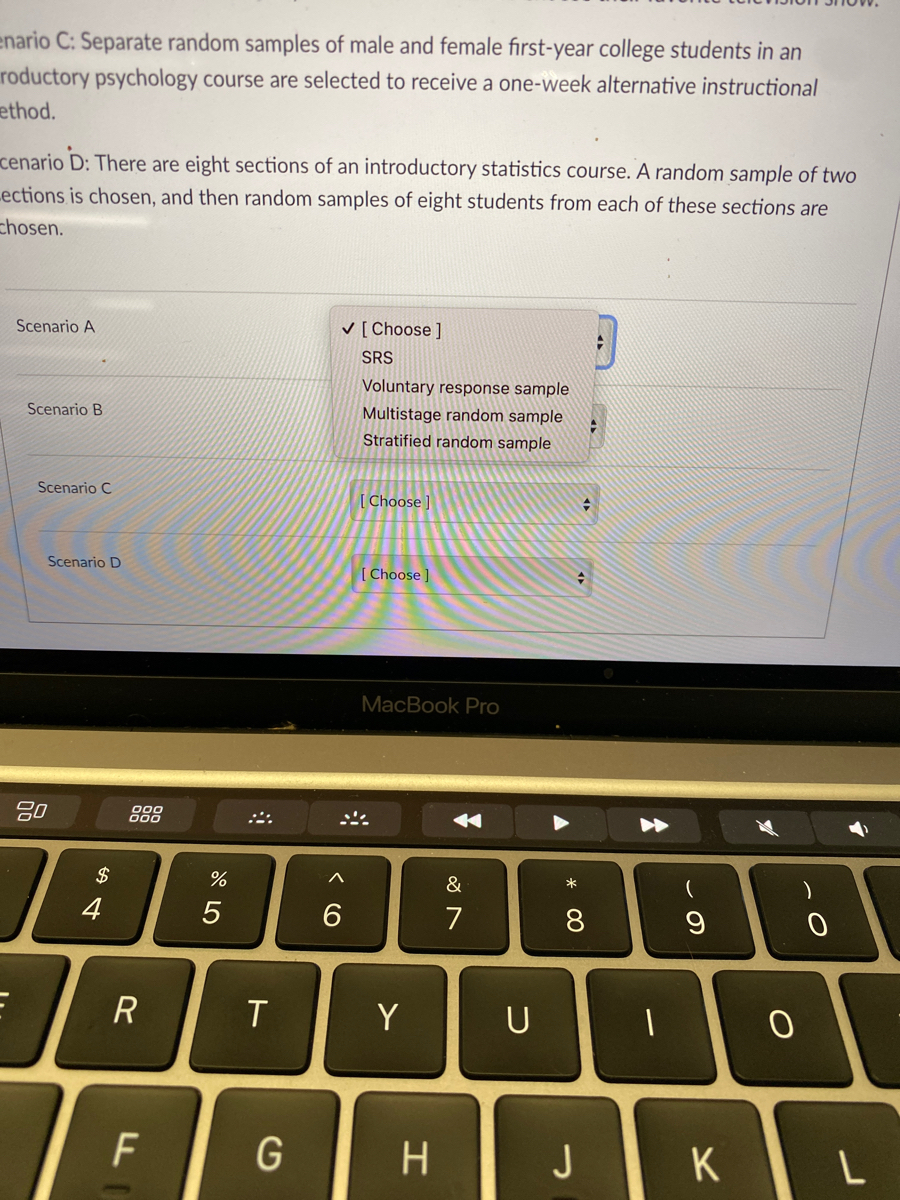
![For each scenario, identify the sample as an SRS, stratified random sample, a multistage random sample, or a voluntary response sample.
**Scenario A:** A student organization has 45 members. A table of random digits is used to select a sample of 4.
**Scenario B:** An online poll asks people who visit this site to choose their favorite television show.
**Scenario C:** Separate random samples of male and female first-year college students in an introductory psychology course are selected to receive a one-week alternative instructional method.
**Scenario D:** There are eight sections of an introductory statistics course. A random sample of two sections is chosen, and then random samples of eight students from each of these sections are chosen.
**Options for each scenario:**
- [Choose]
There is no graph or diagram in the image.](https://content.bartleby.com/qna-images/question/6f0561ea-00fb-4c75-a2e9-c26d09539570/86ff75b5-333c-4769-9211-a8bb63d0209f/c1mxxrm_processed.jpeg)
Transcribed Image Text:For each scenario, identify the sample as an SRS, stratified random sample, a multistage random sample, or a voluntary response sample.
**Scenario A:** A student organization has 45 members. A table of random digits is used to select a sample of 4.
**Scenario B:** An online poll asks people who visit this site to choose their favorite television show.
**Scenario C:** Separate random samples of male and female first-year college students in an introductory psychology course are selected to receive a one-week alternative instructional method.
**Scenario D:** There are eight sections of an introductory statistics course. A random sample of two sections is chosen, and then random samples of eight students from each of these sections are chosen.
**Options for each scenario:**
- [Choose]
There is no graph or diagram in the image.
Expert Solution
This question has been solved!
Explore an expertly crafted, step-by-step solution for a thorough understanding of key concepts.

This is a popular solution

Trending nowThis is a popular solution!

Step by stepSolved in 3 steps

Knowledge Booster

Similar questions
- A researcher is interested in factors related to academic performance of students. She hypothesized that for undergraduate students, there is an association between academic majors (STEM, Business, Education, Nursing) and amount of time spent studying each week (less than 3 days, 3 to 6 days, everyday). To test her hypothesis, she randomly selected 1000 undergraduate students from various colleges/universities in Texas, and then classified each participant according to their major and amount of study time each week. For her study, she found test-statistic of 23.75 and a p-value of 0.0006. Using this information, fill in the necessary information below for her test. Distribution used: a. chi-square distribution, 3 degrees of freedom b. chi-square distribution, 4 degrees of freedom c. chi-square distribution, 6 degrees of freedom d. chi-square distribution, 12 degrees of freedomarrow_forwardAthabasca Fishing Lodge is located on Lake Athabasca in northern Canada. In one of its recent brochures, the lodge advertises that 75% of its guests catch northern pike over 20 pounds. Suppose that last summer 65 out of a random sample of 84 guests did, in fact, catch northern pike weighing over 20 pounds. Does this indicate that the population proportion of guests who catch pike over 20 pounds is different from 75% (either higher or lower)? Use? = 0.05 . Is the sample size large enough to approximate distribution using Normal distribution? WHY?.b. What are the hypotheses?arrow_forwardWhen two births are randomly selected, the sample space for genders is bb, bg, gb, and gg. Assume that those four outcomes are equally likely. Construct a table that describes the sampling distribution of the sample proportion of girls sample proportions equal the proportion of girls in two births? Does the result suggest that a sample proportion is an unbiased estimator of a population proportion? For the entire population, assume the probability of having a boy is is not affected by how many boys or girls have previously been born. Determine the probabilities of each sample proportion. Sample proportion of girls ▼ Does the mean of the sample proportions equal the proportion of girls in two births? O A. Yes, both the mean of the sample proportions and the population proportion are 4 1 O B. Yes, both the mean of the sample proportions and the population proportion are 3 O C. Yes, both the mean of the sample proportions and the population proportion are 1 2 O D. No, the mean of the…arrow_forward
- Mike Jimenez is president of the teachers’ union for Preston School District. In preparing for upcoming negotiations, he would like to investigate the salary structure of classroom teachers in the district. He believes there are three factors that affect a teacher’s salary: years of experience, a rating of teaching effectiveness given by the principal, and whether the teacher has a master’s degree (0 = No, 1 = Yes). A random sample of 20 teachers resulted in the following data. Salary ($ Thousands) Years of Experience Principal's Rating Master's Degree 51.1 8 95 0 43.6 5 84 0 39.3 2 100 1 53 15 51 1 48.6 11 53 0 55 14 81 1 52 9 85 0 46.8 7 52 1 58.6 22 68 1 41.7 3 97 1 35.7 1 83 0 40.6 5 71 0 61.8 23 77 1 46.7 17 61 0 48.4 12 83 1 43.6 14 71 0 51.8 8 59 1 40.7 4 93 0 42.8 2 58 1 42.9 8 90 0 a. What is the question being asked? b. Label your dependent variable: y = c. Label your independent variables: x1 = x2 = x3 = d.…arrow_forwardIn 2014, Scotland was considering independence from England, going so far as to take a referendum vote. One opinion poll taken at the time showed that 51% of Scots favored "independence." In another poll taken at that same time, only 34% favored being "separate" from England. The primary reason these results differed by so much is that a. samples will usually differ just by chance due to random sampling. b. the wording of questions has a big effect on poll results. c. more follow-up efforts reduced the nonresponse rate of the second poll. d. the sample sizes are different, so the margins of error are different.arrow_forwardThe Women’s Institutional Studies group at a Midwestern university wanted to compare the percentages of female faculty members in the various units on campus in Spring 2004. Of particular interest were the percentages of female faculty in the College of Education and in the College of Business . In a sample of 80 College of Education faculties, there were 36 females, and in a sample of 70 College of Business faculties, there were 15 females. Based upon this sample information, which of the following is the 98% confidence interval for the difference in the actual percentages of female faculty between College of Education and College of Business ? a. (0.075, 0.405). b. (0.123, 0.357). c. (-0.012, 0.252). d. (0.058, 0.422). e. (0.101, 0.379).arrow_forward
- 58% of all statistics classes require a statistical calculator and 30% require the use of a computer that has statistical software. Of the classes that require a statistical calculator, 16% also require the use of a computer. If a statistics course is selected at random find: (round to 4 decimal places where possible) a. P(Statistical Calculator) = b. P(Statistical Software) = c. P(Require a Statistical Calculator and Statistical Software) = d. P(Require a Statistical Calculator GIVEN Require Statistical Software) =arrow_forwardA company is started by four friends. The company was Erica’s idea, so she wants to fill 70% of the orders. Jen, Heather, and Tonya each agree to fill 10% of the orders. After a successful first year, Erica wants to determine if the distribution of the number of orders filled is adhering to the agreed-upon percentages. To do so, she selects a random sample of 100 orders from the large number of orders that were filled and determines who filled the order. What is the name of the appropriate inference procedure? chi-square test for goodness of fit one-sample t-test for a difference in means two-sample t-test for a difference in means two-sample z-test for a difference in proportionsarrow_forwardThe Bureau of Labor Statistics reports that the official unemployment rate for Black people was 10.4% and 4.7% for White people in February 2015. Select all correct answers for this question. O The samples of white and black people are independent. The explanatory variable is the unemployment rate. The response variable is the unemployment rate. The response variable is race.arrow_forward
- When two births are randomly selected, the sample space for genders is bb, bg. gb, and gg. Assume that those four outcomes are equally likely. Construct a table that describes the sampling distribution of the sample proportion of girls from two births. Does the mean of the sample proportions equal the proportion of girls in two births? Does the result suggest that a sample proportion an unbiased estimator of a population proportion? For the entire population, assume the probability of having a boy is the probability of having a girl is , and this is not affected by how many boys or girls have previously been born. 2 Determine the probabilities of each sample proportion. Probability Sample proportion of girls Tune intanare or cimnlifiad frartinnearrow_forwardSuppose that a consultant is helping the owner of a local jewelry store set prices for a sale. The owner is considering applying a discount to its most popular engagement ring, currently priced at $1500. The consultant wants to determine if the average amount consumers spend on similar engagement rings is more than $1500. To do this, she selects a random sample of 15 other jewelry stores in the area and records the prices of engagement rings with a similar style, cut, and weight. The prices of these rings are shown below. $1400, $1230, $1450, $1175, $1850, $1060, $1390, $1260, $2850, $1580, $1500, $1850, $1770, $1400, $1775 Using this sample data, she calculates a mean of $1569.33 and a standard deviation of $432.16 and plans to use this information to conduct a one-sample t-test of Ho μ = $1500 against H₁ μ> $1500. Is this an appropriate use of a one-sample t-test? No, because the sample contains an outlier. Yes, because the population is normally distributed. Yes, because the data…arrow_forwardA warehouse manager wants to know if there is an association between the shift worked and being on time for work. To investigate, he selects a random sample of 70 workers and classifies each one according to the shift they worked most recently and whether they were on time for work. He was unable to classify a substantial number of people as being on time, so he classified those individuals as unknown. The data are displayed in the table. The manager would like to know if these data provide convincing evidence of an association between the shift worked and being on time in the large population of all workers at this warehouse. The random and 10% conditions are met. Is the Large Counts condition met? Yes, the smallest expected count is 5, so all expected counts are at least 5. Yes, the smallest expected count is 8.54, so all expected counts are at least 5. No, the smallest expected count is 2.56, so the expected counts are not all at least 5. No, the smallest expected count is…arrow_forward
arrow_back_ios
SEE MORE QUESTIONS
arrow_forward_ios
Recommended textbooks for you
- MATLAB: An Introduction with ApplicationsStatisticsISBN:9781119256830Author:Amos GilatPublisher:John Wiley & Sons Inc
 Probability and Statistics for Engineering and th...StatisticsISBN:9781305251809Author:Jay L. DevorePublisher:Cengage Learning
 Statistics for The Behavioral Sciences (MindTap C...StatisticsISBN:9781305504912Author:Frederick J Gravetter, Larry B. WallnauPublisher:Cengage Learning
  Elementary Statistics: Picturing the World (7th E...StatisticsISBN:9780134683416Author:Ron Larson, Betsy FarberPublisher:PEARSON
 The Basic Practice of StatisticsStatisticsISBN:9781319042578Author:David S. Moore, William I. Notz, Michael A. FlignerPublisher:W. H. Freeman
 Introduction to the Practice of StatisticsStatisticsISBN:9781319013387Author:David S. Moore, George P. McCabe, Bruce A. CraigPublisher:W. H. Freeman
MATLAB: An Introduction with Applications
Statistics
ISBN:9781119256830
Author:Amos Gilat
Publisher:John Wiley & Sons Inc
Probability and Statistics for Engineering and th...
Statistics
ISBN:9781305251809
Author:Jay L. Devore
Publisher:Cengage Learning
Statistics for The Behavioral Sciences (MindTap C...
Statistics
ISBN:9781305504912
Author:Frederick J Gravetter, Larry B. Wallnau
Publisher:Cengage Learning
Elementary Statistics: Picturing the World (7th E...
Statistics
ISBN:9780134683416
Author:Ron Larson, Betsy Farber
Publisher:PEARSON
The Basic Practice of Statistics
Statistics
ISBN:9781319042578
Author:David S. Moore, William I. Notz, Michael A. Fligner
Publisher:W. H. Freeman
Introduction to the Practice of Statistics
Statistics
ISBN:9781319013387
Author:David S. Moore, George P. McCabe, Bruce A. Craig
Publisher:W. H. Freeman