ENGR.ECONOMIC ANALYSIS
14th Edition
ISBN: 9780190931919
Author: NEWNAN
Publisher: Oxford University Press
expand_more
expand_more
format_list_bulleted
Question

Transcribed Image Text:PRICE
Numbers and Graphs Q2
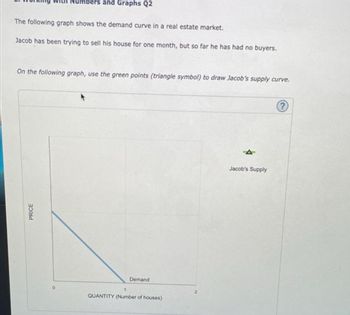
The following graph shows the demand curve in a real estate market.
Jacob has been trying to sell his house for one month, but so far he has had no buyers.
On the following graph, use the green points (triangle symbol) to draw Jacob's supply curve.
Demand
QUANTITY (Number of houses)
ለ
Jacob's Supply
Expert Solution
This question has been solved!
Explore an expertly crafted, step-by-step solution for a thorough understanding of key concepts.
This is a popular solution
Trending nowThis is a popular solution!
Step by stepSolved in 3 steps with 1 images

Knowledge Booster
Learn more about
Need a deep-dive on the concept behind this application? Look no further. Learn more about this topic, economics and related others by exploring similar questions and additional content below.Similar questions
- The increase in demand is represented by a movement up in the demand curve. Is this statement true or false? illustrate your answer on a demand and supply graph.arrow_forwardSuppose both the demand for olives and the supply of olives decline by equal amounts over some time period. Use graphical analysis to show the effect on equilibrium price and quantity. Instructions: On the graph below, use your mouse to click and drag the supply and demand curves as necessary. D1 Quantity of olives Price of olivesarrow_forwardExplain by graph the situation when the quantity demanded greater than the quantity supplied in the market.arrow_forward
- Ch 23 Economicsarrow_forwardSuppose Disney+ changes its monthly subscription price from $7 to $9 per month. Graphically show the impact of this price change in the following markets: a. Popcorn, pizza, and other movie snacks Instructions: Drag the supply or demand curve to its new position. b. Netflix Instructions: Drag the supply or demand curve to its new position.arrow_forwardUse grapharrow_forward
- The following graph shows the market for cereal in San Diego, where there are over 1,000 stores that sell cereal at any given moment. Suppose a new scientific study shows that San Diego is the most polluted city in the world. Due to health concerns, a significant number of families move out of the city. *graph Now suppose Congress passes a new tax that decreases the income of San Diego residents. If cereal is a normal good, this will cause the demand for cereal to increase or decrease?arrow_forwardSupposed the law prescribed the renter to vacate an apartment within 30 days after being served with an eviction notice. To protect renters, the government passes a new law under which the renter must vacate the apartment in 90 days. The following graph shows the market for rental properties, where the demand curve represents demand for apartments under the old eviction law. Adjust the following graph to show the effect of the new eviction law on the market for rental properties. PRICE (Apartment Rent) 140 126 112 98 84 70 56 42 28 14 0 + Based on the graph, the rental price Supply 011 22 33 44 55 68 77 88 99 110 QUANTITY (Apartments) to $ Demand Demand Supply ? and the number of available apartments For the first drop down the choices are rises/falls and for the second drop down the choices are increases/decreases.arrow_forwardWhat does the movement from point A to point C represent on the below graph: Price (dollars per unit) Quantity (millions of units per month) a) Change in quantity demanded. b) Movement up the demand curve c) Decrease in demand. d) Change in demand.arrow_forward
- There is a market for Purses. There is a decrease in the cost of leather. Describe and graph the next scenario.arrow_forwardThe following graph shows the demand for a good. 140 50 i i 20 Demand 10 25 35 70 QUANTITY (Units) PRICE (Dollars per unit)arrow_forwardThe following table shows the annual demand and supply in the market for orange juice in San Diego. Price (Dollars per gallon of orange juice) 2 12 4 6 8 10 9 (axınl abuex Quantity Demanded (Gallons of orange juice) 500 400 300 200 100 On the following graph, plot the demand for orange juice using the blue point (circle symbol). Next, plot the supply of orange juice using the orange point (square symbol). Finally, use the black point (plus symbol) to indicate the equilibrium price and quantity in the market for orange juice. Note: Plot your points in the order in which you would like them connected. Line segments will connect the points automatically. Quantity Supplied (Gallons of orange juice) 50 150 200 300 450 Demand --arrow_forward
arrow_back_ios
SEE MORE QUESTIONS
arrow_forward_ios
Recommended textbooks for you

 Principles of Economics (12th Edition)EconomicsISBN:9780134078779Author:Karl E. Case, Ray C. Fair, Sharon E. OsterPublisher:PEARSON
 Engineering Economy (17th Edition)EconomicsISBN:9780134870069Author:William G. Sullivan, Elin M. Wicks, C. Patrick KoellingPublisher:PEARSON
 Principles of Economics (MindTap Course List)EconomicsISBN:9781305585126Author:N. Gregory MankiwPublisher:Cengage Learning
 Managerial Economics: A Problem Solving ApproachEconomicsISBN:9781337106665Author:Luke M. Froeb, Brian T. McCann, Michael R. Ward, Mike ShorPublisher:Cengage Learning
 Managerial Economics & Business Strategy (Mcgraw-...EconomicsISBN:9781259290619Author:Michael Baye, Jeff PrincePublisher:McGraw-Hill Education


Principles of Economics (12th Edition)
Economics
ISBN:9780134078779
Author:Karl E. Case, Ray C. Fair, Sharon E. Oster
Publisher:PEARSON

Engineering Economy (17th Edition)
Economics
ISBN:9780134870069
Author:William G. Sullivan, Elin M. Wicks, C. Patrick Koelling
Publisher:PEARSON

Principles of Economics (MindTap Course List)
Economics
ISBN:9781305585126
Author:N. Gregory Mankiw
Publisher:Cengage Learning

Managerial Economics: A Problem Solving Approach
Economics
ISBN:9781337106665
Author:Luke M. Froeb, Brian T. McCann, Michael R. Ward, Mike Shor
Publisher:Cengage Learning

Managerial Economics & Business Strategy (Mcgraw-...
Economics
ISBN:9781259290619
Author:Michael Baye, Jeff Prince
Publisher:McGraw-Hill Education