ENGR.ECONOMIC ANALYSIS
14th Edition
ISBN: 9780190931919
Author: NEWNAN
Publisher: Oxford University Press
expand_more
expand_more
format_list_bulleted
Question

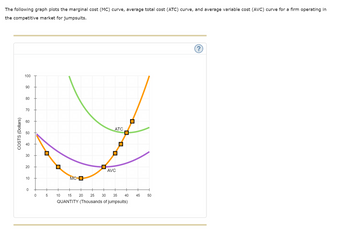
Transcribed Image Text:The following graph plots the marginal cost (MC) curve, average total cost (ATC) curve, and average variable cost (AVC) curve for a firm operating in
the competitive market for jumpsuits.
COSTS (Dollars)
100
90
80
70
60
40
30
20
10
0
0
0
5
▬▬
MC
ATC
AVC
10 15 20 25 30 35
QUANTITY (Thousands of jumpsuits)
40
☐
45
50

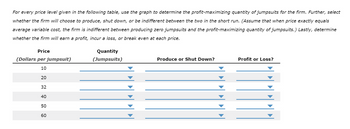
Transcribed Image Text:For every price level given in the following table, use the graph to determine the profit-maximizing quantity of jumpsuits for the firm. Further, select
whether the firm will choose to produce, shut down, or be indifferent between the two in the short run. (Assume that when price exactly equals
average variable cost, the firm is indifferent between producing zero jumpsuits and the profit-maximizing quantity of jumpsuits.) Lastly, determine
whether the firm will earn a profit, incur a loss, or break even at each price.
Price
(Dollars per jumpsuit)
10
20
32
40
50
60
Quantity
(Jumpsuits)
Produce or Shut Down?
Profit or Loss?
Expert Solution
This question has been solved!
Explore an expertly crafted, step-by-step solution for a thorough understanding of key concepts.
This is a popular solution
Trending nowThis is a popular solution!
Step by stepSolved in 2 steps

Knowledge Booster
Learn more about
Need a deep-dive on the concept behind this application? Look no further. Learn more about this topic, economics and related others by exploring similar questions and additional content below.Similar questions
- I only need help with part e and part f.arrow_forward(A) The Marginal cost of a firm is $230 and the marginal revenue is $255 What would be the value of Marginal profit (B) is the firm maximizing its profit?arrow_forwardPRICE (dollars per unit) 2 QUANTITY PRICE OR COST (dollars per unit) QUANTITY MC ATC AVC MR Question 40 If the firm in the figure above raised the price of its product abvove $4, the firm would: a. increase its profits b. reduce its total revenue to zero c. increase its total revenue but not its profits because costs would increase. d. not affect revenues at all but profits would increase because costs decrease e. none of the abovearrow_forward
- The value of marginal revenue is $35 and the value of marginal cost is $30 Is the firm maximizing profits?arrow_forwardThe graph shows the short-run cost curves of a toy producer. The market has 1,000 identical toy producers. The market price of a toy is $21. In the short run, the firm produces toys a week. 24- 21- 18- 15- 12- 9- 0 500 1000 1500 2000 MC ATC AVC 2500arrow_forwardPrice Marginal Cost 3 Price Marginal Revenue Quantity (a) Find the point (A, B, C, D, or E) that corresponds to the profit maximizing price and quantity. (Select only one letter.) (b) Which number corresponds to consumer surplus on the graph? (c) Which number corresponds to producer surplus on the graph? (d) Which number corresponds to deadweight loss on the graph?arrow_forward
- Price (dollars per cup) $6.00 MC ATC 3.50 A 2.50 B Demand 0 1 2 3 4 5 6 7 8 9 10 Quantity MR (cups per week) According to the graph, if the firm is maximizing profits what is the dollar value of the profit?arrow_forwardPlease no written by hand and no image According to the Washington Post article The Downsides of Cheap Corn, farmers' 2014 crop revenues were down from prior years, despite very productive harvests all around the United States. Which of the statements is the explanation offered by the article for this apparent paradox? The costs of farming have increased faster than productivity, leading to higher crop yields but lower profits. An influx of farmers entering the agricultural market has led to fierce competition, driving down revenues. The increase in the supply of crops has decreased prices by a greater percentage than the percentage increase in quantity of sales. Consumer demand for agricultural crops such as corn, soybean, and wheat are at record lowsarrow_forwardPrice (dollars per soda) 2.50 2.00 1.50 1.00 0.50 Market Price 0 5 10 15 20 25 Quantity (thousands of sodas per month) The supply curve of Coca Cola is given above. The market price is $1.00 per soda. The marginal cost of the 20,000th soda is $0.50. $1.00. more than $1.00. $0.00. Sarrow_forward
- $1200 $1000 $1000 D3 $600 D3 D1 D2 \D1 D2 0 300 500 650 500 Computers Per Week Computers Per Week A Refer to the graphs. Suppose a firm is currently producing 500 computers per week and charging a price of $1,000. What happens to the firm's inventory of computers if there is a negative demand shock and prices are inflexible? Multiple Choice The firm's inventory will increase by 200 computers per week. The firm's inventory will not change. The firm's inventory will decrease by 150 computers per week. The firm's inventory will increase by 350 computers per week. rch 99+ Price Pricearrow_forwardPrice ($) 1000 500 300 0 300 500 Supply Demand What is the total cost of producing 300 iPads? 1000 Quantityarrow_forwardIf an economy the marginal profit is $80 billion and the marginal cost is $35 billion find the marginal revenue!arrow_forward
arrow_back_ios
SEE MORE QUESTIONS
arrow_forward_ios
Recommended textbooks for you

 Principles of Economics (12th Edition)EconomicsISBN:9780134078779Author:Karl E. Case, Ray C. Fair, Sharon E. OsterPublisher:PEARSON
 Engineering Economy (17th Edition)EconomicsISBN:9780134870069Author:William G. Sullivan, Elin M. Wicks, C. Patrick KoellingPublisher:PEARSON
 Principles of Economics (MindTap Course List)EconomicsISBN:9781305585126Author:N. Gregory MankiwPublisher:Cengage Learning
 Managerial Economics: A Problem Solving ApproachEconomicsISBN:9781337106665Author:Luke M. Froeb, Brian T. McCann, Michael R. Ward, Mike ShorPublisher:Cengage Learning
 Managerial Economics & Business Strategy (Mcgraw-...EconomicsISBN:9781259290619Author:Michael Baye, Jeff PrincePublisher:McGraw-Hill Education


Principles of Economics (12th Edition)
Economics
ISBN:9780134078779
Author:Karl E. Case, Ray C. Fair, Sharon E. Oster
Publisher:PEARSON

Engineering Economy (17th Edition)
Economics
ISBN:9780134870069
Author:William G. Sullivan, Elin M. Wicks, C. Patrick Koelling
Publisher:PEARSON

Principles of Economics (MindTap Course List)
Economics
ISBN:9781305585126
Author:N. Gregory Mankiw
Publisher:Cengage Learning

Managerial Economics: A Problem Solving Approach
Economics
ISBN:9781337106665
Author:Luke M. Froeb, Brian T. McCann, Michael R. Ward, Mike Shor
Publisher:Cengage Learning

Managerial Economics & Business Strategy (Mcgraw-...
Economics
ISBN:9781259290619
Author:Michael Baye, Jeff Prince
Publisher:McGraw-Hill Education