
MATLAB: An Introduction with Applications
6th Edition
ISBN: 9781119256830
Author: Amos Gilat
Publisher: John Wiley & Sons Inc
expand_more
expand_more
format_list_bulleted
Related questions
Question
thumb_up100%

Transcribed Image Text:Practice 6.5: Using Two-Way Frequency Tables
A
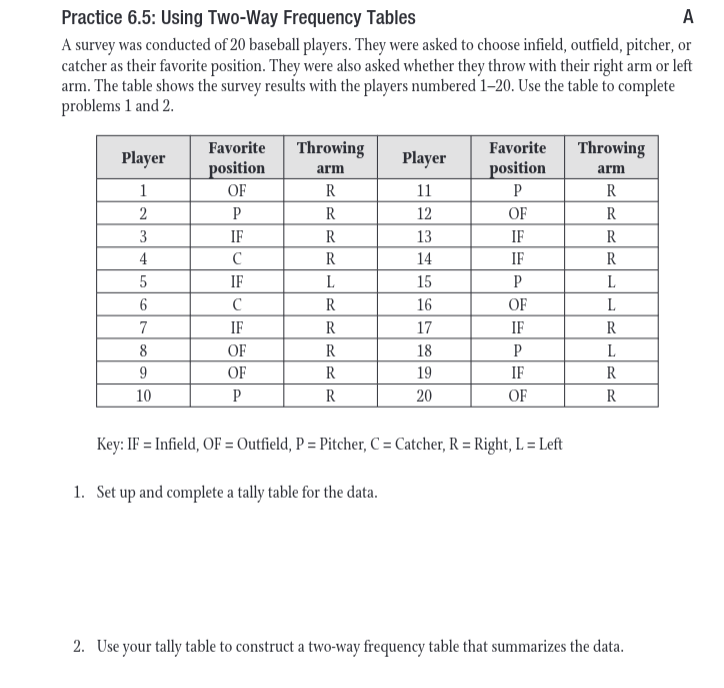
A survey was conducted of 20 baseball players. They were asked to choose infield, outfield, pitcher, or
catcher as their favorite position. They were also asked whether they throw with their right arm or left
arm. The table shows the survey results with the players numbered 1-20. Use the table to complete
problems 1 and 2.
Player
1
2
3
4
5
6
7
8
9
10
Favorite
position
OF
P
IF
C
IF
с
IF
OF
OF
P
Throwing
arm
R
R
R
R
L
R
R
R
R
R
Player
11
12
13
14
15
16
17
18
19
20
Favorite
position
P
OF
IF
IF
P
OF
IF
P
IF
OF
Key: IF = Infield, OF = Outfield, P = Pitcher, C = Catcher, R = Right, L = Left
1. Set up and complete a tally table for the data.
Throwing
arm
R
R
R
R
L
L
R
L
R
R
2. Use your tally table to construct a two-way frequency table that summarizes the data.
Expert Solution
This question has been solved!
Explore an expertly crafted, step-by-step solution for a thorough understanding of key concepts.

This is a popular solution

Trending nowThis is a popular solution!

Step by stepSolved in 3 steps

Knowledge Booster

Similar questions
- 3. Complete the two-way frequency table below about the type of party your little sister's friends enjoy the most. Gender Male Female Total 2 Party Туре Bowling Skating Dancing 3 11 Total Part A: Determine P(Male). Part B: Determine P(Skating). Part C: Determine P(Male and Skating). Part D: Determine P(Male or Skating).arrow_forwardThe data to the right represent the number of chocolate chips per cookie in a random sample of a name brand and a store brand. Complete parts (a) to (c) below. (a) Draw side-by-side boxplots for each brand of cookie. Label the boxplots "N" for the name brand and "S" for the store brand Choose the correct answer below. O A. OB. O C. O D. S 10 N- 20 30 40 Q 17 S N- 10 20 30 40 9.1 ✔ N- 27 S- 10 20 30 40 Q N- ام 10 20 30 Name Brand 20 22 25 27 30 20 29 33 21 Full data set D Store Brand 24 23 21 27 19 26 24 33 15 23 22 26 22 28 17 25 28 40 Garrow_forwardA drink vendor randomly asked college students how many soft drinks they had consumed during the past week. Their answers were as follows: 5,0,2,1.1.9,0,1,0,3,1.1.4,3,4, and 7. a. Make a frequency table (NOT grouped). b. Make a histogram based on the frequency table. c. Make a frequency polygon based on the frequency table. d. Describe the shape of the histogram (i.e., mode?, skewed? etc.).arrow_forward
- For each vignette, choose the type of research that is being conducted. There is only one correct answer for each vignette. Here are your answer choices for questions 1-18 Case Study Naturalistic Observation Laboratory Observation Survey Correlation Test Experiment Longitudinal Design Cross Section Cross Sequential Design Maria wants to understand the political demographics in her community, so she creates a questionnaire asking people to identify their age, gender, political affiliation, religion and marital status. After Maria collects the abovementioned data (in question #12), she then identifies the relationships between religion and political affiliation. Kathi…arrow_forwardUsing the following two way frequency table, answer the following question: Have Been to Have Not Been to Canada Canada Have Been to Mexico 6 3 Have Not Been to Mexico 5 11 How many people have NOT been to either country?arrow_forwardA survey wants to ask students about the type of music that they want to hear at a school dance. Create 1 of each of the following survey questions appropriate for this survey: 1. Information, 2. Ranking, 3. Open Write each appropriate survey question, applicable to this situation.arrow_forward
- Use the frequency histogram to complete the following parts. (a) Determine the number of classes. (b) Estimate the greatest and least frequencies. (c) Determine the class width. (d) Describe any patterns with the data. (a) There are (Type a whole number.) classes. (b) The least frequency is about (Round to the nearest whole number as needed.) The greatest frequency is about. (Round to the nearest whole number as needed.) (c) The class width is $0. (Type an integer or a decimal. Do not round.) (d) What pattern does the histogram show? A. About half of the employees' salaries are between $40,000 and $49,000. B. About half of the employees' salaries are between $50,000 and $59,000. C. Most employees make less than $34,000 or more than $60,000. D. Less than half of the employees make between $35,000 and $59,000. Frequency 300- 200- 100- 0- Employee Salaries 32 37 42 47 52 57 62 Salary (in thousands of dollars) Oarrow_forwardA group of students were surveyed about the number of siblings they have. Their responses are summarized in the frequency table below. How many students responded to the survey? Number of Siblings Frequency 0 6 1 8 2 5 3 3 4 1 5 or more 3arrow_forward
arrow_back_ios
arrow_forward_ios
Recommended textbooks for you
- MATLAB: An Introduction with ApplicationsStatisticsISBN:9781119256830Author:Amos GilatPublisher:John Wiley & Sons Inc
 Probability and Statistics for Engineering and th...StatisticsISBN:9781305251809Author:Jay L. DevorePublisher:Cengage Learning
 Statistics for The Behavioral Sciences (MindTap C...StatisticsISBN:9781305504912Author:Frederick J Gravetter, Larry B. WallnauPublisher:Cengage Learning
  Elementary Statistics: Picturing the World (7th E...StatisticsISBN:9780134683416Author:Ron Larson, Betsy FarberPublisher:PEARSON
 The Basic Practice of StatisticsStatisticsISBN:9781319042578Author:David S. Moore, William I. Notz, Michael A. FlignerPublisher:W. H. Freeman
 Introduction to the Practice of StatisticsStatisticsISBN:9781319013387Author:David S. Moore, George P. McCabe, Bruce A. CraigPublisher:W. H. Freeman
MATLAB: An Introduction with Applications
Statistics
ISBN:9781119256830
Author:Amos Gilat
Publisher:John Wiley & Sons Inc
Probability and Statistics for Engineering and th...
Statistics
ISBN:9781305251809
Author:Jay L. Devore
Publisher:Cengage Learning
Statistics for The Behavioral Sciences (MindTap C...
Statistics
ISBN:9781305504912
Author:Frederick J Gravetter, Larry B. Wallnau
Publisher:Cengage Learning
Elementary Statistics: Picturing the World (7th E...
Statistics
ISBN:9780134683416
Author:Ron Larson, Betsy Farber
Publisher:PEARSON
The Basic Practice of Statistics
Statistics
ISBN:9781319042578
Author:David S. Moore, William I. Notz, Michael A. Fligner
Publisher:W. H. Freeman
Introduction to the Practice of Statistics
Statistics
ISBN:9781319013387
Author:David S. Moore, George P. McCabe, Bruce A. Craig
Publisher:W. H. Freeman