
MATLAB: An Introduction with Applications
6th Edition
ISBN: 9781119256830
Author: Amos Gilat
Publisher: John Wiley & Sons Inc
expand_more
expand_more
format_list_bulleted
Related questions
Question
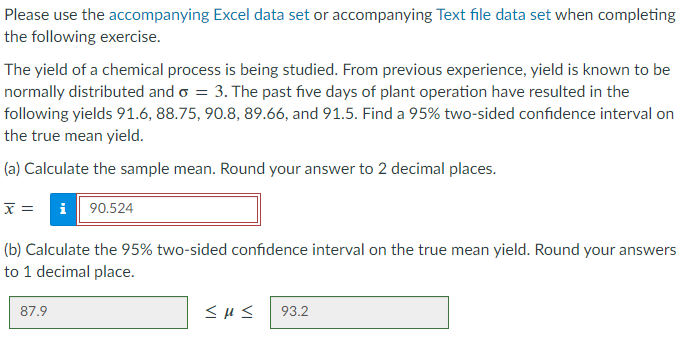

Transcribed Image Text:Please use the accompanying Excel data set or accompanying Text file data set when completing
the following exercise.
The yield of a chemical process is being studied. From previous experience, yield is known to be
normally distributed and o = 3. The past five days of plant operation have resulted in the
following yields 91.6, 88.75, 90.8, 89.66, and 91.5. Find a 95% two-sided confidence interval on
the true mean yield.
(a) Calculate the sample mean. Round your answer to 2 decimal places.
x = i 90.524
(b) Calculate the 95% two-sided confidence interval on the true mean yield. Round your answers
to 1 decimal place.
87.9
<μ< 93.2
Expert Solution
This question has been solved!
Explore an expertly crafted, step-by-step solution for a thorough understanding of key concepts.

This is a popular solution

Trending nowThis is a popular solution!

Step by stepSolved in 3 steps with 1 images

Knowledge Booster

Similar questions
- Answer the attachment below alongside with the breakdown of the answers.arrow_forwardOne year, the mean age of an inmate on death row was 40.9 years. A sociologist wondered whether the mean age of a death-row inmate has changed since then. She randomly selects 32 death-row inmates and finds that their mean age is 39.4, with a standard deviation of 9.5. Construct a 95% confidence interval about the mean age. What does the interval imply? Click the icon to view the table of critical t-values. Choose the correct hypotheses. Ho: H₁: (Type integers or decimals. Do not round.) Construct a 95% confidence interval about the mean age. With 95% confidence, the mean age of a death row inmate is between What does the interval imply? years and years. (Round to two decimal places as needed.) O A. Since the mean age from the earlier year is contained in the interval, there is sufficient evidence to conclude that the mean age had changed. B. Since the mean age from the earlier year is not contained in the interval, there is not sufficient evidence to conclude that the mean age had…arrow_forwardAnswer part carrow_forward
- The number of heart surgeries performed at a hospital has increased over the past several years. The hospital’s administration is seeking the best method to forecast the demand for such surgeries in Year 6. The data for the past five years is shown. Year Demand 1 130 2 139 3 135 4 144 5 141 The hospital is considering the following forecasting methods. Compare the performance of these methods using the mean squared error (MSE). Begin error measurements in year 3 so all methods are compared for the same years. Exponential smoothing, with α = 0.5. let the initial forecast for year 1= 130, the same as the actual demand. Two-year simple moving average Two-year weighted moving average, using weights 0.7 and 0.3, with more recent data given more weight. Solve this problem on a separate paper. Then, use the results to complete the tables provided below, save the file and then submit it on E-learning. 1- Exponential smoothing: Year Forecast…arrow_forwardMrs. Gallas wanted to estimate the average weight of an Oreo cookie to determine if theaverage weight was less than advertised. She selected a random sample of 30 cookies andfound the weight of each cookie (in grams). The mean weight was = 11.1921 grams with astandard deviation of sx = 0.0817 grams. Make a 95% confidence interval to estimate the truemean weight of an Oreo. 1. What is the formula for calculating the standard deviation of the sampling distribution of x? 2.What condition must be met to use this formula? Has it been met?arrow_forward5.1 & 6.2 Question 13, 6.1.34 Part 1 of 2 Use the confidence interval to find the estimated margin of error. Then find the sample mean. HW Score: 44.29%, 15.5 of 35 O Points: 0 of 1 A store manager reports a confidence interval of (44.8,83.8) when estimating the mean price (in dollars) for the population of textbooks. The estimated margin of error is (Type an integer or a decimal.) Clear all his View an example Get more help - Q Searcharrow_forward
- Choose the appropriate statistical test. When computing, be sure to round each answer as indicated. A dentist wonders if depression affects ratings of tooth pain. In the general population, using a scale of 1-10 with higher values indicating more pain, the average pain rating for patients with toothaches is 6.8. A sample of 30 patients that show high levels of depression have an average pain rating of 7.1 (variance 0.8). What should the dentist determine? 1. Calculate the estimated standard error. (round to 3 decimals). [st.error] 2. What is thet-obtained? (round to 3 decimals). 3. What is the t-cv? (exact value) 4. What is your conclusion? Only type "Reject" or Retain"arrow_forwardA company that develops an automated customer service model is interested in knowing whether two versions, Version A and Version B, will get different ratings from customers. Participants in a focus group are taken through samples from both versions, then take a survey to rate each version. A summary of the data obtained from the study is given below. Assume ratings from the different surveys generally have the same standard deviation. Mean Observations Pearson Correlation Hypothesized Mean Difference df t Stat P(T<=t) one-tail t Critical one-tail P(T<=t) two-tail t Critical two-tail Confidence Level Version A Version B 33.133 28.67 15 15 -0.325 0.00 14 n = Ex: 9 -1.426 0.088 -1.345 0.176 -1.761 95% Degrees of freedom: df Point estimate for Version A: XA = Ex: 1.234 Point estimate for Version B: x B = 1 = من t = −1 Ex: 1.234 0 1 t = P = = Ex: 1.234 2 3 2arrow_forward
arrow_back_ios
arrow_forward_ios
Recommended textbooks for you
- MATLAB: An Introduction with ApplicationsStatisticsISBN:9781119256830Author:Amos GilatPublisher:John Wiley & Sons Inc
 Probability and Statistics for Engineering and th...StatisticsISBN:9781305251809Author:Jay L. DevorePublisher:Cengage Learning
 Statistics for The Behavioral Sciences (MindTap C...StatisticsISBN:9781305504912Author:Frederick J Gravetter, Larry B. WallnauPublisher:Cengage Learning
  Elementary Statistics: Picturing the World (7th E...StatisticsISBN:9780134683416Author:Ron Larson, Betsy FarberPublisher:PEARSON
 The Basic Practice of StatisticsStatisticsISBN:9781319042578Author:David S. Moore, William I. Notz, Michael A. FlignerPublisher:W. H. Freeman
 Introduction to the Practice of StatisticsStatisticsISBN:9781319013387Author:David S. Moore, George P. McCabe, Bruce A. CraigPublisher:W. H. Freeman
MATLAB: An Introduction with Applications
Statistics
ISBN:9781119256830
Author:Amos Gilat
Publisher:John Wiley & Sons Inc
Probability and Statistics for Engineering and th...
Statistics
ISBN:9781305251809
Author:Jay L. Devore
Publisher:Cengage Learning
Statistics for The Behavioral Sciences (MindTap C...
Statistics
ISBN:9781305504912
Author:Frederick J Gravetter, Larry B. Wallnau
Publisher:Cengage Learning
Elementary Statistics: Picturing the World (7th E...
Statistics
ISBN:9780134683416
Author:Ron Larson, Betsy Farber
Publisher:PEARSON
The Basic Practice of Statistics
Statistics
ISBN:9781319042578
Author:David S. Moore, William I. Notz, Michael A. Fligner
Publisher:W. H. Freeman
Introduction to the Practice of Statistics
Statistics
ISBN:9781319013387
Author:David S. Moore, George P. McCabe, Bruce A. Craig
Publisher:W. H. Freeman