MATLAB: An Introduction with Applications
6th Edition
ISBN: 9781119256830
Author: Amos Gilat
Publisher: John Wiley & Sons Inc
expand_more
expand_more
format_list_bulleted
Question

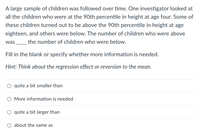
Transcribed Image Text:A large sample of children was followed over time. One investigator looked at
all the children who were at the 90th percentile in height at age four. Some of
these children turned out to be above the 90th percentile in height at age
eighteen, and others were below. The number of children who were above
was
the number of children who were below.
Fill in the blank or specify whether more information is needed.
Hint: Think about the regression effect or reversion to the mean.
quite a bit smaller than
More information is needed
quite a bit larger than
about the same as
Expert Solution
This question has been solved!
Explore an expertly crafted, step-by-step solution for a thorough understanding of key concepts.
Step by stepSolved in 2 steps

Knowledge Booster
Similar questions
- A study was undertaken to see how accurate food labeling for calories on food that is considered reduced calorie. The group measured the amount of calories for each item of food and then found the percent difference between the measured and labeled amount of calories. The group also looked at food that was nationally advertised, regionally distributed, or locally prepared. Do the data indicate that at least one of the mean percent differences between the three groups is different from the others? The data summarized in the table below. National 3.15 Regional 36.75 Local Mean Standard Deviation Source Between Within 151 Total Fill in the hypotheses below: Ho: All the means are equal. Ha: At least one mean is different from the others. 7.4359 14.1558 SS 70.0204 Part 2 of 3 Complete the following ANOVA summary table (a 0.10). Round your answers to three decimal places, if necessary, and round any interim calculations to four decimal places. Sample Size df 20 12 8 MS - F P-valuearrow_forwardYou are told that the proportion p-hat of those who answered "yes" to a poll about internet use is p-hat = 0.70, and the standard error of the proportion is 0.0458. What was the sample size?arrow_forward. A Pew poll taken in 2010 surveyed 830 people aged 18-29 and found that 166 of them had one or more tattoos. Based on this survey, can you conclude that the percentage of people aged 18-29 who have a tattoo is less than 25%? Use the a = significance. 0.01 level ofarrow_forward
- If a person’s z score equals 1.61, what percentage of the observations are more extreme?arrow_forwardA news article that you read stated that 50% of voters prefer the Democratic candidate. You think that the actual percent is smaller. 128 of the 284 voters that you surveyed said that they prefer the Democratic candidate. What can be concluded at the 0.01 level of significance?arrow_forwardIf you are given a set of sample data and want to determine if it is reasonable to assume that the sample data came from a normal population, briefly discuss the graphs that you would need to make and what you would be looking for in each graph.arrow_forward
- Please also explain why you determined whether or not the results are statistically significant. In another memory experiment, the mean scores for participants in Condition A and Condition B came out exactly the same!arrow_forwardSo far, Walter has scores of 18, 17, 19, and 21 points for the first four science quizzes. What does he need to score on the next quiz in order to achieve an average(mean) score of 20 points per quiz?arrow_forwardThe claim is that the proportion of peas with yellow pods is equal to 0.25 (or 25%). The sample statistics from one experiment include 450 peas with 117 of them having yellow pods. Find the value of the test statistic.arrow_forward
- On average, a sample of n = 36 scores will provide a better estimate of the population mean than a sample of n = 49 scores from the same population.arrow_forwardYou are told that the proportion p-hat of those who answered "yes" to a poll about internet use is p-hat = 0.70, and the standard error of the proportion is 0.0458. What was the sample size?arrow_forwardIn a data set with 25 scores, if the value 16 occurs 12 times, what is its relative frequency?arrow_forward
arrow_back_ios
SEE MORE QUESTIONS
arrow_forward_ios
Recommended textbooks for you
 MATLAB: An Introduction with ApplicationsStatisticsISBN:9781119256830Author:Amos GilatPublisher:John Wiley & Sons Inc
 Probability and Statistics for Engineering and th...StatisticsISBN:9781305251809Author:Jay L. DevorePublisher:Cengage Learning
 Statistics for The Behavioral Sciences (MindTap C...StatisticsISBN:9781305504912Author:Frederick J Gravetter, Larry B. WallnauPublisher:Cengage Learning
 Elementary Statistics: Picturing the World (7th E...StatisticsISBN:9780134683416Author:Ron Larson, Betsy FarberPublisher:PEARSON
 The Basic Practice of StatisticsStatisticsISBN:9781319042578Author:David S. Moore, William I. Notz, Michael A. FlignerPublisher:W. H. Freeman
 Introduction to the Practice of StatisticsStatisticsISBN:9781319013387Author:David S. Moore, George P. McCabe, Bruce A. CraigPublisher:W. H. Freeman

MATLAB: An Introduction with Applications
Statistics
ISBN:9781119256830
Author:Amos Gilat
Publisher:John Wiley & Sons Inc

Probability and Statistics for Engineering and th...
Statistics
ISBN:9781305251809
Author:Jay L. Devore
Publisher:Cengage Learning

Statistics for The Behavioral Sciences (MindTap C...
Statistics
ISBN:9781305504912
Author:Frederick J Gravetter, Larry B. Wallnau
Publisher:Cengage Learning

Elementary Statistics: Picturing the World (7th E...
Statistics
ISBN:9780134683416
Author:Ron Larson, Betsy Farber
Publisher:PEARSON

The Basic Practice of Statistics
Statistics
ISBN:9781319042578
Author:David S. Moore, William I. Notz, Michael A. Fligner
Publisher:W. H. Freeman

Introduction to the Practice of Statistics
Statistics
ISBN:9781319013387
Author:David S. Moore, George P. McCabe, Bruce A. Craig
Publisher:W. H. Freeman